article thumbnail

DataOps For Business Analytics Teams

DataKitchen

Business analysts must rapidly deliver value and simultaneously manage fragile and error-prone analytics production pipelines. Data tables from IT and other data sources require a large amount of repetitive, manual work to be used in analytics. In business analytics, fire-fighting and stress are common.

article thumbnail

What is business analytics? Using data to improve business outcomes

CIO Business Intelligence

What is business analytics? Business analytics is the practical application of statistical analysis and technologies on business data to identify and anticipate trends and predict business outcomes. The discipline is a key facet of the business analyst role. Business analytics techniques.

Insiders

Sign Up for our Newsletter

This site is protected by reCAPTCHA and the Google Privacy Policy and Terms of Service apply.

article thumbnail

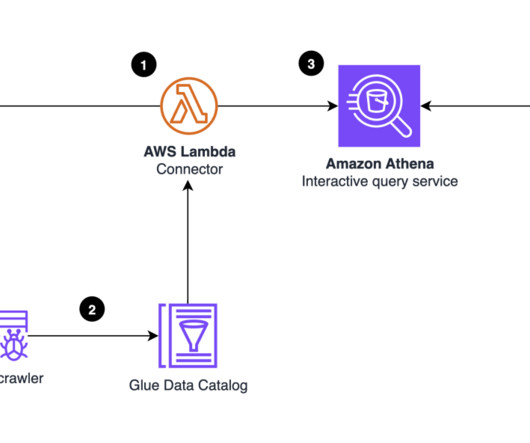
Visualize Amazon DynamoDB insights in Amazon QuickSight using the Amazon Athena DynamoDB connector and AWS Glue

AWS Big Data

Finally, to visualize BI insights, you can use Amazon QuickSight , a cloud-powered business analytics service. QuickSight makes it straightforward for organizations to build visualizations, perform ad hoc analysis, and quickly get business insights from their data, anytime, on any device. Choose Create data source.

article thumbnail

What is data analytics? Analyzing and managing data for decisions

CIO Business Intelligence

More specifically: Descriptive analytics uses historical and current data from multiple sources to describe the present state, or a specified historical state, by identifying trends and patterns. In business analytics, this is the purview of business intelligence (BI). Data analytics and data science are closely related.

article thumbnail

What is a business intelligence analyst? A key role for data-driven decisions

CIO Business Intelligence

Business intelligence (BI) analysts transform data into insights that drive business value. This is done by mining complex data using BI software and tools , comparing data to competitors and industry trends, and creating visualizations that communicate findings to others in the organization.

article thumbnail

A Guide To The Methods, Benefits & Problems of The Interpretation of Data

datapine

Through the art of streamlined visual communication, data dashboards permit businesses to engage in real-time and informed decision-making and are key instruments in data interpretation. Typically, quantitative data is measured by visually presenting correlation tests between two or more variables of significance.

article thumbnail

What is the Independent Samples T Test Method of Analysis and How Can it Benefit an Organization?

Smarten

This article focuses on the Independent Samples T Test technique of Hypothesis testing. What is the Independent Samples T Test Method of Hypothesis Testing? Let’s look at a sample of the Independent t-test on two variables. How Can the Independent Samples T Test Method Benefit an Organization? About Smarten.

Testing 40