article thumbnail

Smarten Announces SnapShot Anomaly Monitoring Alerts: Powerful Tools for Business Users!

Smarten

Smarten announces the launch of SnapShot Anomaly Monitoring Alerts for Smarten Augmented Analytics. SnapShot Monitoring provides powerful data analytical features that reveal trends and anomalies and allow the enterprise to map targets and adapt to changing markets with clear, prescribed actions for continuous improvement.

article thumbnail

Smarten Augmented Analytics is Named as a Representative Vendor in Gartner® 2023 ‘Market Guide for Augmented Analytics, Published October, 2023!

Smarten

The Smarten Augmented Analytics suite includes Smart Data Visualization , AI and Assisted Predictive Modeling , Self-Serve Data Preparation , Natural Language Processing (NLP) and Search Analytics , SnapShot Monitoring and Alerts , and many other sophisticated features.

Insiders

Sign Up for our Newsletter

This site is protected by reCAPTCHA and the Google Privacy Policy and Terms of Service apply.

article thumbnail

How to Use Apache Iceberg in CDP’s Open Lakehouse

Cloudera

With Iceberg in CDP, you can benefit from the following key features: CDE and CDW support Apache Iceberg: Run queries in CDE and CDW following Spark ETL and Impala business intelligence patterns, respectively. Exploratory data science and visualization: Access Iceberg tables through auto-discovered CDW connection in CML projects.

article thumbnail

What is business intelligence? Transforming data into business insights

CIO Business Intelligence

Business intelligence definition Business intelligence (BI) is a set of strategies and technologies enterprises use to analyze business information and transform it into actionable insights that inform strategic and tactical business decisions.

article thumbnail

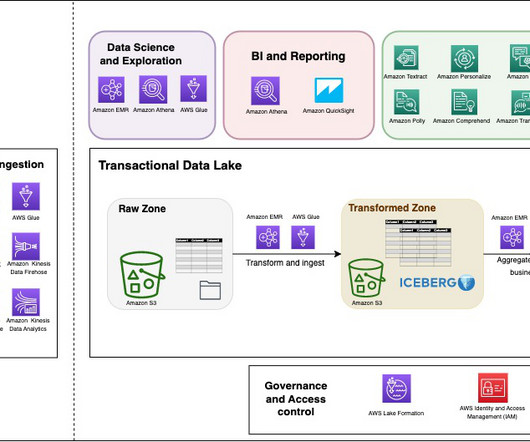
Build a serverless transactional data lake with Apache Iceberg, Amazon EMR Serverless, and Amazon Athena

AWS Big Data

However, as data processing at scale solutions grow, organizations need to build more and more features on top of their data lakes. Additionally, the task of maintaining and managing files in the data lake can be tedious and sometimes complex.

article thumbnail

Data Observability and Monitoring with DataOps

DataKitchen

And the worst part – data errors take the fun out of data science. Remember your first data science courses? You probably imagined your career would be about helping drive insights with data instead of having to sit in endless meetings discussing analytics errors and painstaking corrective actions.

Testing 214
article thumbnail

Move Beyond Excel, PowerPoint And Static Business Reporting with Powerful Interactive Dashboards

datapine

An interactive dashboard is a data management tool that tracks, analyzes, monitors, and visually displays key business metrics while allowing users to interact with data, enabling them to make well-informed, data-driven, and healthy business decisions. The data option will show the raw data behind a chart.