Remove Cost-Benefit Remove Dashboards Remove Data Collection Remove KPI
article thumbnail

What is IoT Dashboard?

FineReport

Among the tools that have emerged from this digital transformation, IoT dashboards stand out as invaluable assets. In this article, we will explore the concept of IoT dashboards, delve into their benefits, examine real-life examples, and highlight the essential features that make them indispensable in the IoT landscape.

IoT 52
article thumbnail

KPI Management And Best Practices: How To Find The Perfect KPI Solutions?

datapine

Table of Contents 1) What Is KPI Management? 2) Why Do KPIs Matter? 3) What Are KPI Best Practices? An even more interesting fact: The blogs we read regularly are not only influenced by KPI management but also concerning content, style, and flow; they’re often molded by the suggestions of these goal-driven metrics.

KPI 221
Insiders

Sign Up for our Newsletter

This site is protected by reCAPTCHA and the Google Privacy Policy and Terms of Service apply.

Trending Sources

article thumbnail

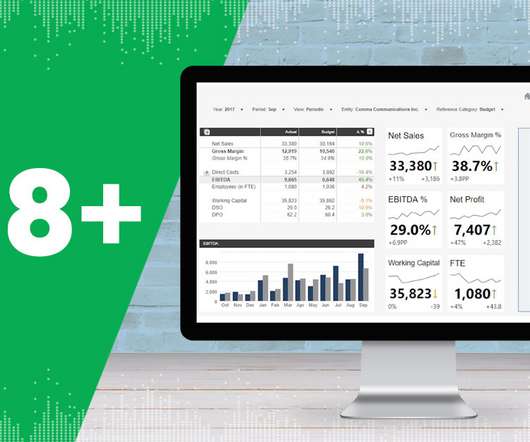
Financial Dashboard: Definition, Examples, and How-tos

FineReport

In today’s dynamic business environment, gaining comprehensive visibility into financial data is crucial for making informed decisions. This is where the significance of a financial dashboard shines through. What is A Financial Dashboard?

article thumbnail

25 Best Healthcare KPIs and Metric Examples for 2021 Reporting

Jet Global

What is a Healthcare KPI? A healthcare Key Performance Indicator (KPI) or metric is a well-defined performance measure that is used to observe, analyze, optimize, and transform a healthcare process to increase satisfaction for both patients and healthcare providers alike. Why Your Business Should Be Using Healthcare Specific KPIs.

Metrics 98
article thumbnail

28 Best Insurance KPIs and Metrics Examples for 2020 Reporting

Jet Global

What Is an Insurance KPI? An insurance Key Performance Indicator (KPI) or metric is a measure that an insurance company uses to monitor its performance and efficiency. These KPIs are often used to compare companies in the insurance industry against each other to see which would be a better investment. View Guide Now.

article thumbnail

Master Data Visualization Techniques: A Comprehensive Guide

FineReport

The significance of data visualization lies in its ability to unveil patterns, trends, and correlations that might otherwise remain hidden within raw data. Benefits of Data Visualization Enhanced Decision-Making : By presenting data visually, individuals can quickly grasp insights and make informed decisions.

article thumbnail

A Beginner’s Guide to Financial Report: Definition, Types, Tools & Templates

FineReport

Some common expenses of an enterprise are the wages paid to employees, the costs of electricity and facilities, and the taxes. Step 2: Collect financial data. Compared with other steps, data collection is a relatively tiring step in financial reporting. First, you need to collect and organize the original receipts.