Remove Cost-Benefit Remove Dashboards Remove Information Remove Interactive
article thumbnail

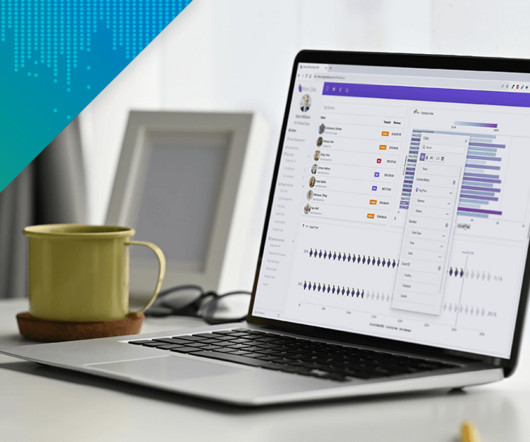
Take Advantage Of The Best Interactive & Effective Data Visualization Examples

datapine

Table of Contents 1) The Benefits Of Data Visualization 2) Our Top 27 Best Data Visualizations 3) Interactive Data Visualization: What’s In It For Me? Moreover, 90% of the information transferred to the brain is visual. 4) Static vs. Animated Data Visualization Data is the new oil? No, data is the new soil.”

article thumbnail

Your Guide To Modern Agency Analytics, Dashboards & Reporting Techniques

datapine

The answer is modern agency analytics reports and interactive dashboards. Starting with its definition, following with the benefits of agency reports, a list of tools, and a set of agency dashboard examples. Explore our 14 days free trial & benefit from interactive agency reports!

Insiders

Sign Up for our Newsletter

This site is protected by reCAPTCHA and the Google Privacy Policy and Terms of Service apply.

Trending Sources

article thumbnail

Get Started With Interactive Weekly Reports For Performance Tracking

datapine

This is where interactive weekly reports come into the picture. Powered by interactive visualizations, managers use these reports to outline the progress of the week and find improvement opportunities for the future. We will see these interactive reports in action throughout the post. What Is A Weekly Report?

article thumbnail

Your Introduction To CFO Dashboards & Reports In The Digital Age

datapine

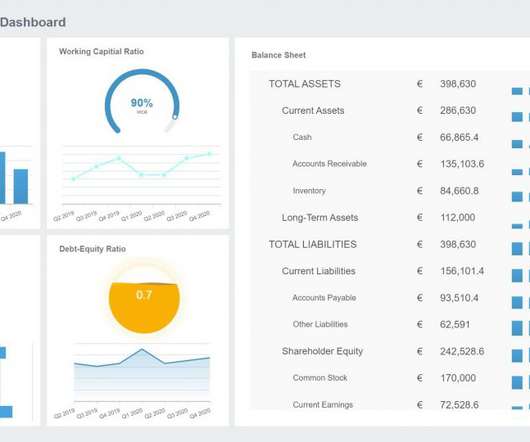
CFO dashboards exist to enhance the strategic as well as the analytical efforts related to every financial aspect of your business. Here, we’ll explore the dynamics of reports for CFOs, look at CFO reporting tools, and consider real-world examples of both CFO dashboards and reports. Benefit from great CFO dashboards & reports!

article thumbnail

An Introduction To Data Dashboards: Meaning, Definition & Industry Examples

datapine

That’s an unfathomable amount of information. Enter data dashboards – one of history’s best innovations in business intelligence. To help you understand this notion in full, we’re going to explore a data dashboard definition, explain the power of dashboard data, and explore a selection of data dashboard examples.

article thumbnail

A Guide To Performing Successful Content Reporting Using Modern Dashboards

datapine

2) What Is A Content Dashboard? 4) Content Dashboards Examples. Modern content performance reports in the shape of an interactive online dashboard present an intuitive and accessible way to assess your content’s success and its ROI in real-time and in one centralized location. What Is A Content Dashboard?

article thumbnail

Get Started With Business Performance Dashboards – Examples & Templates

datapine

That said, if you’re looking to evolve your empire, increase brand awareness, and boost your bottom line, embracing business performance dashboards and big data should be at the top of your priority list. In today’s information-rich age, there is a tangible link between online data analysis and business performance.