Remove Cost-Benefit Remove Dashboards Remove Insurance Remove Visualization
article thumbnail

Insurance Dashboard Design: KPIs, Analytics & Examples

FineReport

Insurance companies provide risk management in the form of insurance contracts. Industry-specific, comprehensive, and reliable data management and presentation have become an issue of increasing concern in the insurance industry. The insurance dashboard is one of the most commonly used data display methods.

article thumbnail

Top 15 Warehouse KPIs & Metrics For Efficient Management 

datapine

3) Top 15 Warehouse KPIs Examples 4) Warehouse KPI Dashboard Template The use of big data and analytics technologies has become increasingly popular across industries. Keep on reading to learn a definition, benefits, and a warehouse KPI list with the most prominent examples any manager should be tracking to achieve operational success.

Metrics 217
Insiders

Sign Up for our Newsletter

This site is protected by reCAPTCHA and the Google Privacy Policy and Terms of Service apply.

Trending Sources

article thumbnail

A Beginner’s Guide To Inventory Metrics And Best Practices

datapine

Collecting big amounts of data is not the only thing to do; knowing how to process, analyze, and visualize the insights you gain from it is key. In the matter, data analysis and dashboard designer software is a precious ally. Your Chance: Want to visualize & track inventory KPIs with ease? What Are Inventory Metrics?

Metrics 286
article thumbnail

18 Examples Of Big Data Analytics In Healthcare That Can Save People

datapine

In fact, healthcare analytics has the potential to reduce costs of treatment, predict outbreaks of epidemics, avoid preventable diseases, and improve the quality of life in general. We will then look at 18 big data examples in healthcare that already exist and that medical-based institutions can benefit from.

Big Data 364
article thumbnail

Digital Dashboards: Strategic & Tactical: Best Practices, Tips, Examples

Occam's Razor

I'm excited about the power of a well created dashboard. Dashboards are every where, we will look at a lot of them in this post and they are all digital. Here's a great dashboard, for the Museum of Art… take a minute to ponder it… Isn't it pretty awesome? And data pukes are not dashboards.

article thumbnail

How FIS ingests and searches vector data for quick ticket resolution with Amazon OpenSearch Service

AWS Big Data

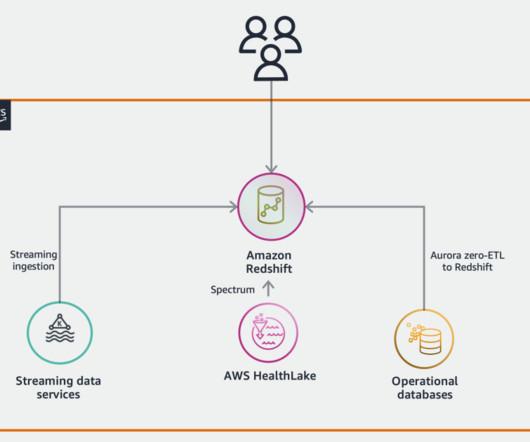
You’ll learn how to implement a transformative solution that empowers your organization with near-real-time data indexing and visualization capabilities. Solution overview The architecture diagram of FIS’s near-real-time data indexing and visualization solution incorporates various AWS services for specific functions.

article thumbnail

Reinventing the Healthcare Enterprise with Analytics

Jet Global

Whether you work in a hospital, long-term care facility, clinical lab, or a HealthTech company, all workers in the healthcare sector today are focused on value-based care and cost efficiencies. A single investment in embedded analytics reaps a multitude of benefits, both inside and outside the medical facility. Report automation?can