Remove Dashboards Remove Data Architecture Remove Data Transformation Remove Metrics
article thumbnail

Deep dive into the AWS ProServe Hadoop Migration Delivery Kit TCO tool

AWS Big Data

Amazon QuickSight dashboards showcase the results from the analyzer. With QuickSight, you can visualize YARN log data and conduct analysis against the datasets generated by pre-built dashboard templates and a widget. The following diagram illustrates the HMDK TCO architecture. Let’s look at some key metrics.

article thumbnail

Create a modern data platform using the Data Build Tool (dbt) in the AWS Cloud

AWS Big Data

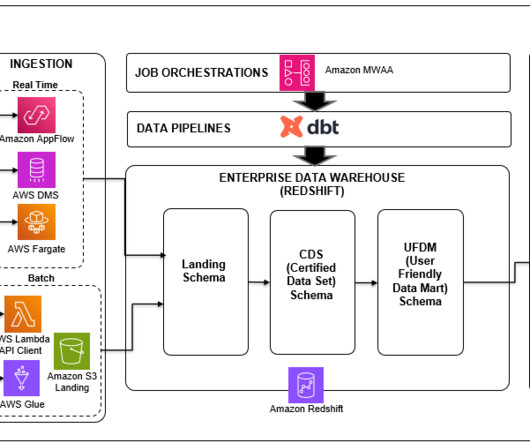
In this post, we delve into a case study for a retail use case, exploring how the Data Build Tool (dbt) was used effectively within an AWS environment to build a high-performing, efficient, and modern data platform. It does this by helping teams handle the T in ETL (extract, transform, and load) processes.

Insiders

Sign Up for our Newsletter

This site is protected by reCAPTCHA and the Google Privacy Policy and Terms of Service apply.

article thumbnail

Introducing the AWS ProServe Hadoop Migration Delivery Kit TCO tool

AWS Big Data

The results of the log analyzer reveal Hadoop workload insights with various views and metrics of the Hadoop applications shown in Amazon QuickSight dashboards, which leads to the design of a future EMR cluster. The QuickSight timeline dashboard shows the peak time job runs because of the daily batch job.

article thumbnail

BMW Cloud Efficiency Analytics powered by Amazon QuickSight and Amazon Athena

AWS Big Data

The CLEA dashboards were built on the foundation of the Well-Architected Lab. For more information on this foundation, refer to A Detailed Overview of the Cost Intelligence Dashboard. The difference lies in when and where data transformation takes place. These ingested datasets are used as a source in CLEA dashboards.

article thumbnail

Build incremental data pipelines to load transactional data changes using AWS DMS, Delta 2.0, and Amazon EMR Serverless

AWS Big Data

Data ingestion – Steps 1 and 2 use AWS DMS, which connects to the source database and moves full and incremental data (CDC) to Amazon S3 in Parquet format. Data transformation – Steps 3 and 4 represent an EMR Serverless Spark application (Amazon EMR 6.9 Let’s refer to this S3 bucket as the raw layer.

article thumbnail

Birst automates the creation of data warehouses in Snowflake

Birst BI

Customers such as Crossmark , DJO Global and others use Birst with Snowflake to deliver the ultimate modern data architecture. Data never leaves Snowflake with Birst’s ability to support the reporting and self-service needs of both centralized IT and decentralized LOB teams.

article thumbnail

What Is Embedded Analytics?

Jet Global

Their dashboards were visually stunning. In turn, end users were thrilled with the bells and whistles of charts, graphs, and dashboards. As rich, data-driven user experiences are increasingly intertwined with our daily lives, end users are demanding new standards for how they interact with their business data.