Remove Dashboards Remove Data Integration Remove Data Quality Remove Metrics
article thumbnail

The Five Use Cases in Data Observability: Mastering Data Production

DataKitchen

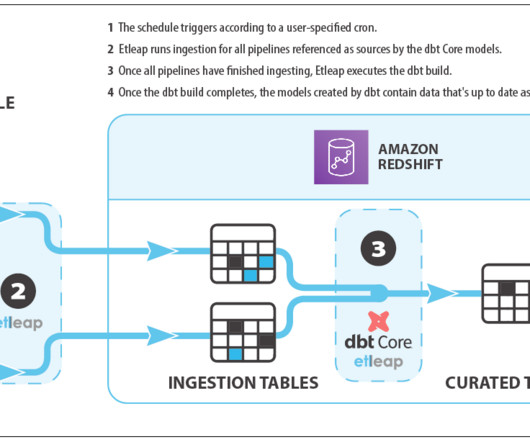
This process is critical as it ensures data quality from the onset. Data Ingestion: Continuous monitoring of data ingestion ensures that updates to existing data sources are consistent and accurate. Examples include regular loading of CRM data and anomaly detection. Do I Have A Troublesome Data Supplier?

Testing 124
article thumbnail

Financial Dashboard: Definition, Examples, and How-tos

FineReport

In today’s dynamic business environment, gaining comprehensive visibility into financial data is crucial for making informed decisions. This is where the significance of a financial dashboard shines through. What is A Financial Dashboard? You can download FineReport for free and have a try!

Insiders

Sign Up for our Newsletter

This site is protected by reCAPTCHA and the Google Privacy Policy and Terms of Service apply.

article thumbnail

Introducing The Five Pillars Of Data Journeys

DataKitchen

Another way to look at the five pillars is to see them in the context of a typical complex data estate. Initially, the infrastructure is unstable, but then we look at our source data and find many problems. Our customers start looking at the data in dashboards and models and then find many issues. Was it on time?

Testing 130
article thumbnail

Sure, Trust Your Data… Until It Breaks Everything: How Automated Data Lineage Saves the Day

Octopai

The goal was to develop sophisticated data products, such as predictive analytics models to forecast patient needs, patient care optimization tools, and operational efficiency dashboards. These data products were intended to enhance patient outcomes, streamline hospital operations, and provide actionable insights for decision-making.

IT 52
article thumbnail

Best BI Tools Examples for 2024: Business Intelligence Software

FineReport

One of the key aspects of the role of BI platforms is their ability to streamline the process of data analysis and decision-making. They offer functionalities that allow for the integration and transformation of raw data into meaningful and actionable insights.

article thumbnail

HR Dashboard: Everything You Need To Know

FineReport

An HR dashboard functions as an advanced analytics tool that utilizes interactive data visualizations to present crucial HR metrics. Similar to various other business departments, human resources is gradually transforming into a data-centric function. What is an HR Dashboard?

article thumbnail

Getting started with AWS Glue Data Quality from the AWS Glue Data Catalog

AWS Big Data

AWS Glue is a serverless data integration service that makes it simple to discover, prepare, and combine data for analytics, machine learning (ML), and application development. Hundreds of thousands of customers use data lakes for analytics and ML to make data-driven business decisions.