Remove Dashboards Remove Data Lake Remove Data Warehouse Remove Data-driven
article thumbnail

Enable business users to analyze large datasets in your data lake with Amazon QuickSight

AWS Big Data

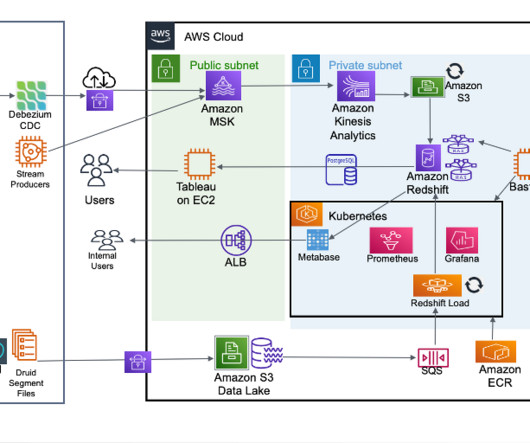
Events and many other security data types are stored in Imperva’s Threat Research Multi-Region data lake. Imperva harnesses data to improve their business outcomes. As part of their solution, they are using Amazon QuickSight to unlock insights from their data.

article thumbnail

5 misconceptions about cloud data warehouses

IBM Big Data Hub

In today’s world, data warehouses are a critical component of any organization’s technology ecosystem. They provide the backbone for a range of use cases such as business intelligence (BI) reporting, dashboarding, and machine-learning (ML)-based predictive analytics, that enable faster decision making and insights.

Insiders

Sign Up for our Newsletter

This site is protected by reCAPTCHA and the Google Privacy Policy and Terms of Service apply.

Trending Sources

article thumbnail

Petabyte-scale log analytics with Amazon S3, Amazon OpenSearch Service, and Amazon OpenSearch Ingestion

AWS Big Data

Organizations often need to manage a high volume of data that is growing at an extraordinary rate. At the same time, they need to optimize operational costs to unlock the value of this data for timely insights and do so with a consistent performance. We think of this concept as inside-out data movement. Example Corp.

Data Lake 114
article thumbnail

Centralize Your Data Processes With a DataOps Process Hub

DataKitchen

Data organizations often have a mix of centralized and decentralized activity. DataOps concerns itself with the complex flow of data across teams, data centers and organizational boundaries. It expands beyond tools and data architecture and views the data organization from the perspective of its processes and workflows.

article thumbnail

Enhance monitoring and debugging for AWS Glue jobs using new job observability metrics, Part 3: Visualization and trend analysis using Amazon QuickSight

AWS Big Data

Grafana provides powerful customizable dashboards to view pipeline health. QuickSight makes it straightforward for business users to visualize data in interactive dashboards and reports. QuickSight makes it straightforward for business users to visualize data in interactive dashboards and reports.

Metrics 106
article thumbnail

Enhance monitoring and debugging for AWS Glue jobs using new job observability metrics

AWS Big Data

For any modern data-driven company, having smooth data integration pipelines is crucial. These pipelines pull data from various sources, transform it, and load it into destination systems for analytics and reporting. Undetected errors result in bad data and impact downstream analysis.

Metrics 97
article thumbnail

Top 5 Tools for Building an Interactive Analytics App

Smart Data Collective

An interactive analytics application gives users the ability to run complex queries across complex data landscapes in real-time: thus, the basis of its appeal. Interactive analytics applications present vast volumes of unstructured data at scale to provide instant insights. Every organization needs data to make many decisions.