Remove Dashboards Remove Data Processing Remove Data Quality Remove Visualization
article thumbnail

The Ultimate Guide to Modern Data Quality Management (DQM) For An Effective Data Quality Control Driven by The Right Metrics

datapine

1) What Is Data Quality Management? 4) Data Quality Best Practices. 5) How Do You Measure Data Quality? 6) Data Quality Metrics Examples. 7) Data Quality Control: Use Case. 8) The Consequences Of Bad Data Quality. 9) 3 Sources Of Low-Quality Data.

article thumbnail

SaaS Dashboard Examples For Modern Business Management Practices

datapine

If you’re part of a growing SaaS company and are looking to accelerate your success, leveraging the power of data is the way to gain a real competitive edge. That’s where SaaS dashboards enter the fold. A SaaS dashboard is a powerful business intelligence tool that offers a host of benefits for ambitious tech businesses.

Insiders

Sign Up for our Newsletter

This site is protected by reCAPTCHA and the Google Privacy Policy and Terms of Service apply.

Trending Sources

article thumbnail

The DataOps Vendor Landscape, 2021

DataKitchen

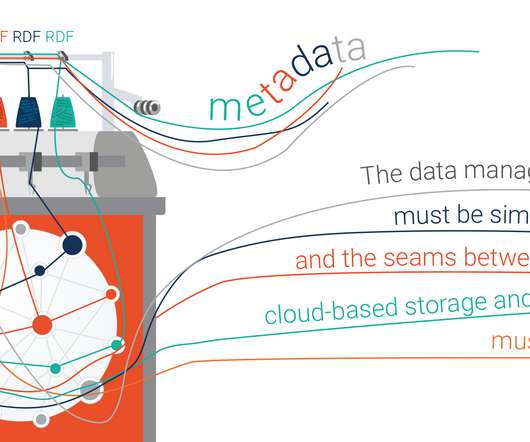
DataOps needs a directed graph-based workflow that contains all the data access, integration, model and visualization steps in the data analytic production process. It orchestrates complex pipelines, toolchains, and tests across teams, locations, and data centers. OwlDQ — Predictive data quality.

Testing 307
article thumbnail

How Dafiti made Amazon QuickSight its primary data visualization tool

AWS Big Data

Data and its various uses is increasingly evident in companies, and each professional has their preferences about which technologies to use to visualize data, which isn’t necessarily in line with the technological needs and infrastructure of a company. In this post, we discuss why we chose QuickSight and how we implemented it.

article thumbnail

The Art and Science of FP&A Storytelling

Timo Elliott

I recently participated in a web seminar on the Art and Science of FP&A Storytelling, hosted by the founder and CEO of FP&A Research Larysa Melnychuk along with other guests Pasquale della Puca , part of the global finance team at Beckman Coulter and Angelica Ancira , Global Digital Planning Lead at PepsiCo. What typically goes wrong?

article thumbnail

Take Advantage Of The Top 16 Sales Graphs And Charts To Boost Your Business

datapine

Because after all – a business dashboard is worth a thousand Excel sheets. This gives to that sales graph an overall sense of visual contrast which makes it much more digestible at a glance. A sales graph example generated with a dashboard builder that will prove invaluable regardless of your niche or sector. click to enlarge**.

Sales 235
article thumbnail

Common Business Intelligence Challenges Facing Entrepreneurs

datapine

These benefits include cost efficiency, the optimization of inventory levels, the reduction of information waste, enhanced marketing communications, and better internal communication – among a host of other business-boosting improvements. Ineffective dashboards can be easily updated to focus on business needs.