Remove Dashboards Remove Data Processing Remove Optimization Remove Statistics
article thumbnail

Get Started With Business Performance Dashboards – Examples & Templates

datapine

That said, if you’re looking to evolve your empire, increase brand awareness, and boost your bottom line, embracing business performance dashboards and big data should be at the top of your priority list. You need data-driven decisions, and a dashboard for business performance will make sure you reap the best possible rewards.

article thumbnail

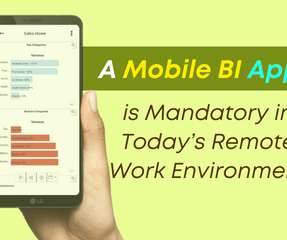
Take Advantage Of Mobile Dashboards – Examples & Selected Designs

datapine

According to the statistics portal Statista , there are currently around 4.78 Mobile technology has changed the way we interact with the world around us, and when it comes to analyzing valuable business insights, mobile dashboards offer the freedom and flexibility to turn stats into success while you’re on the go.

Insiders

Sign Up for our Newsletter

This site is protected by reCAPTCHA and the Google Privacy Policy and Terms of Service apply.

article thumbnail

Gartner D&A Summit Bake-Offs Explored Flooding Impact And Reasons for Optimism!

Rita Sallam

Are there mitigation strategies that show reasons for optimism? Are there mitigation strategies that can be implemented successfully that could provide policy guidance and reasons for optimism in the face of ever increasing frequency of extreme weather events? Based on these estimators, SAS created an easy to use what-if dashboard.

article thumbnail

Take Your SQL Skills To The Next Level With These Popular SQL Books

datapine

With a MySQL dashboard builder , for example, you can connect all the data with a few clicks. A host of notable brands and retailers with colossal inventories and multiple site pages use SQL to enhance their site’s structure functionality and MySQL reporting processes.

article thumbnail

The Ultimate Guide to Modern Data Quality Management (DQM) For An Effective Data Quality Control Driven by The Right Metrics

datapine

As quality issues are often highlighted with the use of dashboard software , the change manager plays an important role in the visualization of data quality. It involves: Reviewing data in detail Comparing and contrasting the data to its own metadata Running statistical models Data quality reports. 2 – Data profiling.

article thumbnail

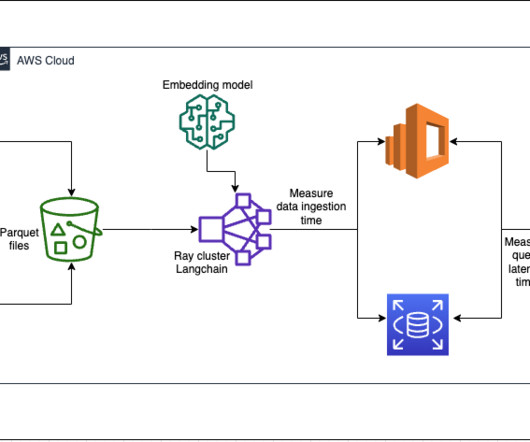
Build a RAG data ingestion pipeline for large-scale ML workloads

AWS Big Data

With optimized configuration, it aims for high recall for the queries. Download the questions From your jump host, download the questions data and upload it to your S3 bucket: stack_name="RAGStack" output_key="S3bucket" export AWS_REGION=$(curl -s [link] | sed 's/(.*)[a-z]/1/') zst`; do zstd -d $F; done rm *.zst

article thumbnail

What you need to know about product management for AI

O'Reilly on Data

But there’s a host of new challenges when it comes to managing AI projects: more unknowns, non-deterministic outcomes, new infrastructures, new processes and new tools. At measurement-obsessed companies, every part of their product experience is quantified and adjusted to optimize user experience. Machine learning adds uncertainty.