Remove Dashboards Remove Data Quality Remove Measurement Remove Optimization
article thumbnail

The Ultimate Guide to Modern Data Quality Management (DQM) For An Effective Data Quality Control Driven by The Right Metrics

datapine

1) What Is Data Quality Management? 4) Data Quality Best Practices. 5) How Do You Measure Data Quality? 6) Data Quality Metrics Examples. 7) Data Quality Control: Use Case. 8) The Consequences Of Bad Data Quality. 9) 3 Sources Of Low-Quality Data.

article thumbnail

Financial Dashboard: Definition, Examples, and How-tos

FineReport

In today’s dynamic business environment, gaining comprehensive visibility into financial data is crucial for making informed decisions. This is where the significance of a financial dashboard shines through. What is A Financial Dashboard?

Insiders

Sign Up for our Newsletter

This site is protected by reCAPTCHA and the Google Privacy Policy and Terms of Service apply.

Trending Sources

article thumbnail

Data Quality vs Data Condition: The Power of Context

Anmut

Data without context is just meaningless noise, and any effort to improve or extract value from your data without considering the larger business context is doomed to fall short.? Unfortunately, traditional approaches to data remediation often focus on technical data quality in isolation from the broader data and business ecosystem.

article thumbnail

Two Downs Make Two Ups: The Only Success Metrics That Matter For Your Data & Analytics Team

DataKitchen

How to measure your data analytics team? So it’s Monday, and you lead a data analytics team of perhaps 30 people. Like most leaders of data analytic teams, you have been doing very little to quantify your team’s success. The Active Data Ratio metric determines the percentage of datasets that deliver value.

Metrics 130
article thumbnail

Common Business Intelligence Challenges Facing Entrepreneurs

datapine

Armed with BI-based prowess, these organizations are a testament to the benefits of using online data analysis to enhance your organization’s processes and strategies. Check out this investor relations dashboard example below, part of our management dashboard series: **click to enlarge**.

article thumbnail

Introducing The Five Pillars Of Data Journeys

DataKitchen

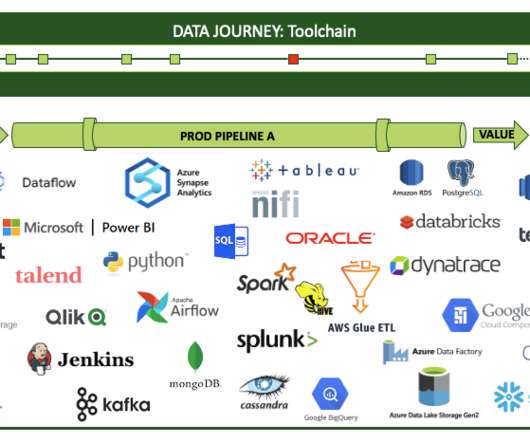
Another way to look at the five pillars is to see them in the context of a typical complex data estate. Initially, the infrastructure is unstable, but then we look at our source data and find many problems. Our customers start looking at the data in dashboards and models and then find many issues. Was it on time?

Testing 130
article thumbnail

DataOps Observability: Taming the Chaos (Part 3)

DataKitchen

As he thinks through the various journeys that data take in his company, Jason sees that his dashboard idea would require extracting or testing for events along the way. So, the only way for a data journey to truly observe what’s happening is to get his tools and pipelines to auto-report events. Part 1) (Part 2).

Testing 130