Remove Dashboards Remove Data Warehouse Remove Reporting Remove Software
article thumbnail

Best 10 Dashboard Reporting Tools You Can’t Miss
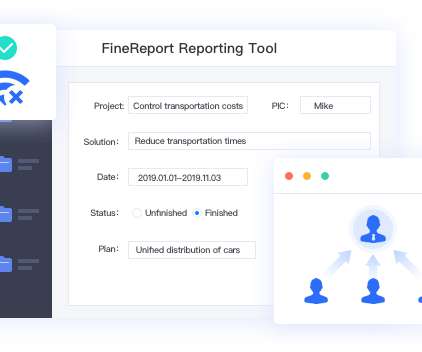
FineReport

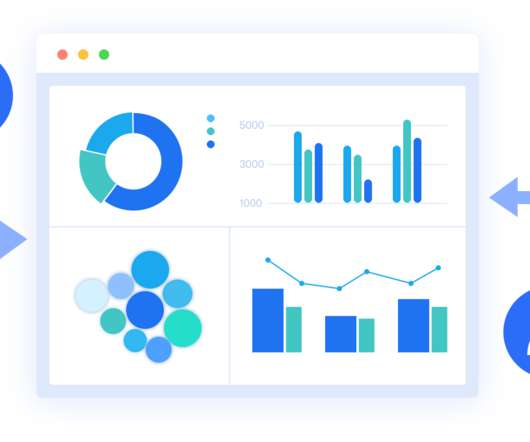
Dashboard reporting refers to putting the relevant business metrics and KPIs in one interface, presenting them visually, dynamic, and in real-time, in the dashboard formats. This article will review the best 10 dashboard tools covering different areas, including open source and free software. FineReport.

article thumbnail

Enable Multi-AZ deployments for your Amazon Redshift data warehouse

AWS Big Data

Amazon Redshift is a fully managed, petabyte scale cloud data warehouse that enables you to analyze large datasets using standard SQL. Data warehouse workloads are increasingly being used with mission-critical analytics applications that require the highest levels of resilience and availability.

Insiders

Sign Up for our Newsletter

This site is protected by reCAPTCHA and the Google Privacy Policy and Terms of Service apply.

article thumbnail

Mastering BI Dashboard Tools: Your Essential Guide

FineReport

In today’s data-driven landscape, businesses are leaning more on BI tools , particularly BI dashboard solutions, to enhance decision-making through data visualization. These BI Dashboard tools blend advanced analytics with user-friendly interfaces, revealing invaluable insights.

article thumbnail

5 misconceptions about cloud data warehouses

IBM Big Data Hub

In today’s world, data warehouses are a critical component of any organization’s technology ecosystem. They provide the backbone for a range of use cases such as business intelligence (BI) reporting, dashboarding, and machine-learning (ML)-based predictive analytics, that enable faster decision making and insights.

article thumbnail

Financial Dashboard: Definition, Examples, and How-tos

FineReport

In today’s dynamic business environment, gaining comprehensive visibility into financial data is crucial for making informed decisions. This is where the significance of a financial dashboard shines through. What is A Financial Dashboard? These reports include the cash flow statement, income statement, and balance sheet.

article thumbnail

Business Intelligence Dashboard (BI Dashboard): Best Practices and Examples

FineReport

With the advent of Business Intelligence Dashboard (BI Dashboard), access to information is no longer limited to IT departments. Every user can now create interactive reports and utilize data visualization to disseminate knowledge to both internal and external stakeholders.

article thumbnail

Combine transactional, streaming, and third-party data on Amazon Redshift for financial services

AWS Big Data

The following are some of the key business use cases that highlight this need: Trade reporting – Since the global financial crisis of 2007–2008, regulators have increased their demands and scrutiny on regulatory reporting. This will be your OLTP data store for transactional data. version cluster. version cluster.