Remove Dashboards Remove Enterprise Remove KPI Remove Visualization
article thumbnail

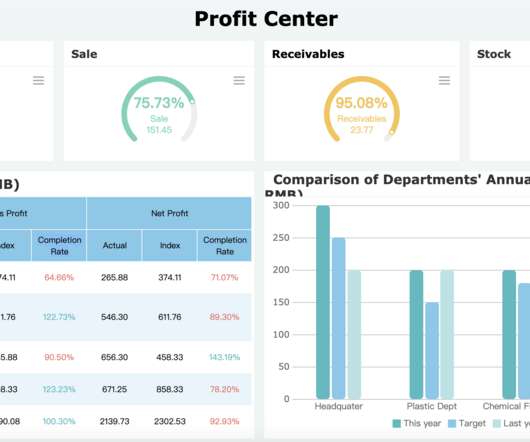
Build Up Your Performance With KPI Scorecards – Examples & Templates

datapine

In this post, we will explain what is a KPI scorecard, when to use it, what is the difference between scorecard and dashboard, and KPI scorecard examples and templates from business scenarios that can be applied to different departments and organizations or used as a roadmap for online data analysis. What Is A KPI Scorecard?

Scorecard 226
article thumbnail

Discover Powerful Small Business Dashboards & KPIs To Track For Success

datapine

1) What Is A Small Business Dashboard? 2) What Are Small Business KPIs? 3) Why Do You Need Small Business Dashboards. 4) Small Business Dashboard & KPIs Examples. The times were data analysis was segregated to big enterprises that had the necessary resources to carry it out are long gone.

Insiders

Sign Up for our Newsletter

This site is protected by reCAPTCHA and the Google Privacy Policy and Terms of Service apply.

Trending Sources

article thumbnail

KPI Dashboard: Keys To Achieve Better Performance

FineReport

KPI dashboard releases you from your worries and troubles. What is a KPI dashboard? Definition of KPI dashboard. KPIs (Key performance indicators) are quantitative indicators used to measure the work performance of staff, being the foundation of an enterprise performance management system.

KPI 52
article thumbnail

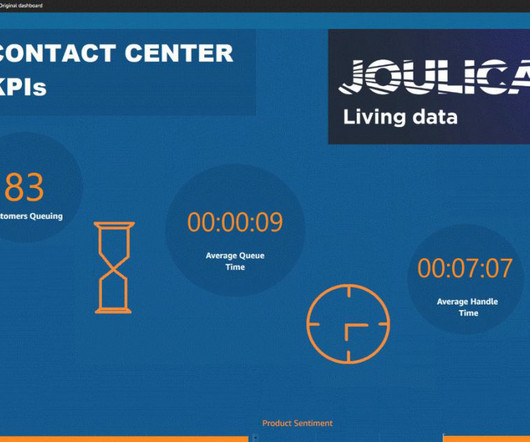
SaaS Dashboard Examples For Modern Business Management Practices

datapine

That’s where SaaS dashboards enter the fold. A SaaS dashboard is a powerful business intelligence tool that offers a host of benefits for ambitious tech businesses. Exclusive Bonus Content: Your Definitive Guide to SaaS & Dashboards! Geet our bite-sized free summary and start building your dashboards!

article thumbnail

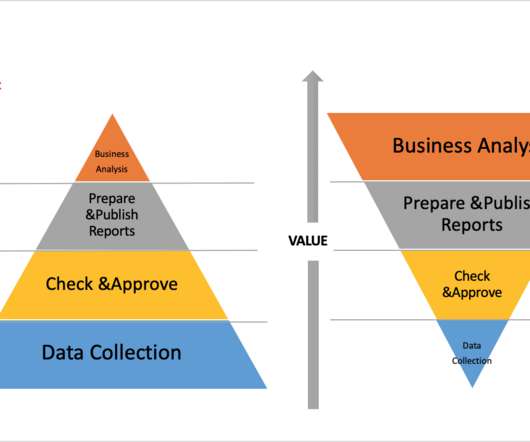
Master Data Visualization Techniques: A Comprehensive Guide

FineReport

Data visualization techniques are paramount in today’s data-driven world. Mastering data visualization techniques is not just a skill but a necessity for professionals across various industries. Definition and Importance Visualizing data involves representing information through graphical elements like charts and graphs.

article thumbnail

Customer Retention Dashboard & Metrics Examples For Modern Companies

datapine

Companies, organizations, enterprises, large, or small businesses – no matter in which category you belong to, you need to pay close attention to your customers. Your Chance: Want to build a dashboard for customer retention? Try our professional dashboard software for 14 days, completely free! click to enlarge**.
article thumbnail

Why Dashboard Visualization Matters in the 21st century?

FineReport

Data dashboard visualization plays a key role in business, whether about analysis or decision. It empowers every user to understand complex data in a visual way. Now, let’s explore the dashboard visualization! What is Dashboard Visualization? dashboard visualization (by Finereport?.