Remove Dashboards Remove Interactive Remove Metrics Remove Optimization
article thumbnail

Customer Retention Dashboard & Metrics Examples For Modern Companies

datapine

A customer retention dashboard and metrics depicted in a neat visual will help you in monitoring, analyzing, and managing multiple customer-centric points and how they echo in your business. Your Chance: Want to build a dashboard for customer retention? Try our professional dashboard software for 14 days, completely free!

article thumbnail

Top 15 Warehouse KPIs & Metrics For Efficient Management 

datapine

3) Top 15 Warehouse KPIs Examples 4) Warehouse KPI Dashboard Template The use of big data and analytics technologies has become increasingly popular across industries. Making the use of warehousing metrics a huge competitive advantage. That is where warehouse metrics and KPIs come into play. 2) Why Do You Need Warehouse KPIs?

Metrics 217
Insiders

Sign Up for our Newsletter

This site is protected by reCAPTCHA and the Google Privacy Policy and Terms of Service apply.

article thumbnail

Your Guide To Modern Agency Analytics, Dashboards & Reporting Techniques

datapine

The answer is modern agency analytics reports and interactive dashboards. Starting with its definition, following with the benefits of agency reports, a list of tools, and a set of agency dashboard examples. Explore our 14 days free trial & benefit from interactive agency reports! What Are Agency Analytics?

article thumbnail

Get Started With Interactive Weekly Reports For Performance Tracking

datapine

This is where interactive weekly reports come into the picture. Armed with powerful visualizations and real-time data, modern weekly summary reports enable businesses to closely monitor their performance and the progress of their strategies to extract relevant insights and optimize their processes to ensure constant growth.

article thumbnail

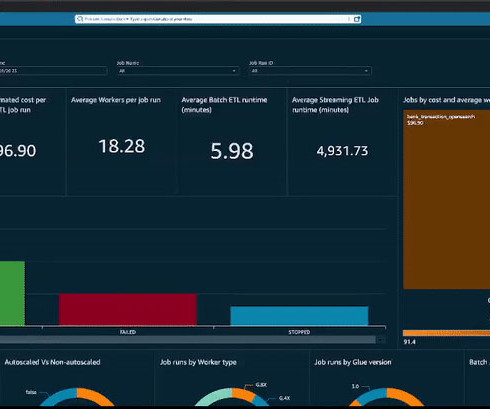
Deploy Amazon QuickSight dashboards to monitor AWS Glue ETL job metrics and set alarms

AWS Big Data

In this post, we explore how to combine AWS Glue usage information and metrics with centralized reporting and visualization using QuickSight. You have metrics available per job run within the AWS Glue console, but they don’t cover all available AWS Glue job metrics, and the visuals aren’t as interactive compared to the QuickSight dashboard.

Metrics 83
article thumbnail

Take Advantage Of The Best Interactive & Effective Data Visualization Examples

datapine

Table of Contents 1) The Benefits Of Data Visualization 2) Our Top 27 Best Data Visualizations 3) Interactive Data Visualization: What’s In It For Me? Whether static or interactive dashboards , these creative data visualization examples will serve as an inspiration for any data enthusiast. No, data is the new soil.”

article thumbnail

Your Introduction To CFO Dashboards & Reports In The Digital Age

datapine

CFO dashboards exist to enhance the strategic as well as the analytical efforts related to every financial aspect of your business. Here, we’ll explore the dynamics of reports for CFOs, look at CFO reporting tools, and consider real-world examples of both CFO dashboards and reports. Benefit from great CFO dashboards & reports!