article thumbnail

The Usability of Dashboards (Part 1): Does Anyone Actually Use These Things?

Jet Global

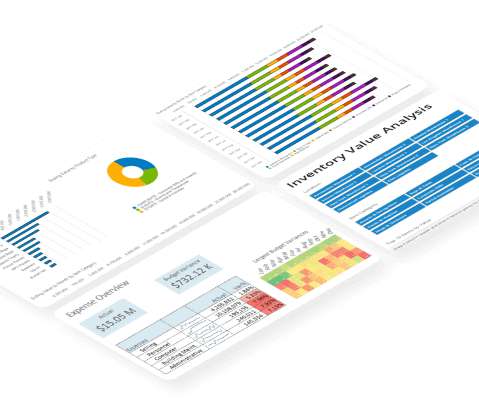
Dashboards showing ever-increasing levels of information are more and more in demand, but perhaps less and less understood. Sometimes a dashboard is a critical piece of software enabling near-instantaneous responses to extinction-level business catastrophes. What’s a dashboard good for? And what for? talking to humans.

article thumbnail

The top 15 big data and data analytics certifications

CIO Business Intelligence

Certifications measure your knowledge and skills against industry- and vendor-specific benchmarks to prove to employers that you have the right skillset. Organization: INFORMS Price: US$200 for INFORMS members; US$300 for nonmembers How to prepare: A list of study courses and a series of webinars are available through registration.

Big Data 126
Insiders

Sign Up for our Newsletter

This site is protected by reCAPTCHA and the Google Privacy Policy and Terms of Service apply.

Trending Sources

article thumbnail

Transforming the Future of Learning with Analytics

Sisense

Learning Pool’s white paper Measuring the Modern Learner Experience explains how an LRS specifically stores xAPI statements, which at their most basic level combine an actor, a verb, and an object. Insights creates AI-powered dashboards built specifically for learning data analysis.

article thumbnail

Smart Businesses Must Invest in Data Analytics for Higher Conversions

Smart Data Collective

You can use data analytics dashboards on your digital advertising platforms to focus on the best converting traffic, such as the PPC keywords that drive the most sales. It might seem fairly similar to lead magnets, as both of these measures give valid reasons to people for sharing their contact information.

article thumbnail

Extend Power BI with Custom Visuals

Jet Global

Whether you are using the free desktop version or the paid professional version, one of the biggest challenges with Power BI is customizing your dashboards and reports to fit your analytical requirements. When creating or editing a Power BI dashboard, you have access to a ton of different types of visuals. Custom Visuals for Power BI.

article thumbnail

8 Ways Successful Online Business Leverage Big Data

Smart Data Collective

You can also use your own data analytics dashboards to see what customers are telling you. Create Webinars. If you sell a service rather than a physical product, a free webinar is a fantastic way of reaching out to potential clients and showcasing a snippet of your work. Use Data Analytics to Optimize Your Social Media Strategy.

Big Data 104
article thumbnail

The New Normal for FP&A: Data Analytics

Jedox

Today, though, the growing volume of data (currently measured in brontobytes = 10^ 27th power) and the advanced technologies available mean you can get much deeper insights much faster than you could in the past. Data analytics is not new. Self-service reporting. Drill-down capability. Exception reporting.