Remove Data Collection Remove Reporting Remove Visualization Remove Workshop
article thumbnail

Three Ways Intentional Data Viz Has Elevated My Work

Depict Data Studio

She has long been passionate about creating data visualizations that are easy to understand, tell a story, and help stakeholders make informed decisions. I want my clients to take away key points from the qualitative data I collect and report. What My Qualitative Data Visualization Used to Look Like.

article thumbnail

Digital Dashboard: Make You Prosper In Digital Era

FineReport

Are you still using the traditional cumbersome and redundant data collection methods? Have you ever neglected key indicators because of irrelevant data in your decision-making? Digital dashboard also realizes the tracking of data and indicators for monitoring the operating conditions of the enterprises.

Insiders

Sign Up for our Newsletter

This site is protected by reCAPTCHA and the Google Privacy Policy and Terms of Service apply.

article thumbnail

15 best data science bootcamps for boosting your career

CIO Business Intelligence

An education in data science can help you land a job as a data analyst , data engineer , data architect , or data scientist. It’s a fast growing and lucrative career path, with data scientists reporting an average salary of $122,550 per year , according to Glassdoor. Top 15 data science bootcamps.

article thumbnail

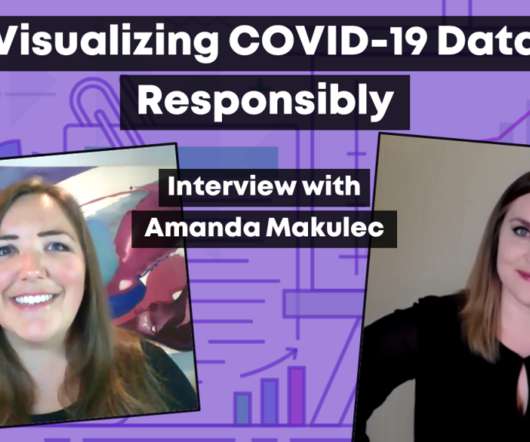
Visualizing COVID-19 Data Responsibly: An Interview with Amanda Makulec

Depict Data Studio

In April, I sat down with Amanda Makulec, one of my longtime data and evaluation friends, to learn about visualizing COVID-19 responsibly. Amanda is the Data Visualization Capability Lead at Excella; a co-organizer for Dataviz DC; and the Operations Director for the Data Visualization Society (DVS).

article thumbnail

Unlocking Growth Potential: A Guide to Effective KPI Tracking

FineReport

By carefully selecting appropriate KPIs for different business areas, they can be utilized to organize and visualize extensive datasets. This approach not only helps extract additional value from organizational data but also facilitates setting targets and measuring incremental progress in crucial areas of the business.

KPI 52
article thumbnail

How to Design Reports that Actually Inform Decisions

Depict Data Studio

I used to write hundred-page reports… I was trained to write lengthy reports filled with statistical jargon. Now, I design reports that people actually want to read. My audience can understand the information, so the data actually gets used. Reports aren’t supposed to feel daunting. Fewer paragraphs.

article thumbnail

Human-centered design and data-driven insights elevate precision in government IT modernization

IBM Big Data Hub

This meant that each enhancement recommendation was not only infused with the voice of the stakeholders and end users, but also included strategic business case developments in which AZDCS was able to measure and report upon the impacts to their business.