Remove Data Integration Remove Data Warehouse Remove Demo Remove Metrics
article thumbnail

Enhance monitoring and debugging for AWS Glue jobs using new job observability metrics, Part 3: Visualization and trend analysis using Amazon QuickSight

AWS Big Data

In Part 2 of this series, we discussed how to enable AWS Glue job observability metrics and integrate them with Grafana for real-time monitoring. In this post, we explore how to connect QuickSight to Amazon CloudWatch metrics and build graphs to uncover trends in AWS Glue job observability metrics.

Metrics 105
article thumbnail

Build and manage your modern data stack using dbt and AWS Glue through dbt-glue, the new “trusted” dbt adapter

AWS Big Data

dbt is an open source, SQL-first templating engine that allows you to write repeatable and extensible data transforms in Python and SQL. dbt is predominantly used by data warehouses (such as Amazon Redshift ) customers who are looking to keep their data transform logic separate from storage and engine.

Data Lake 103
Insiders

Sign Up for our Newsletter

This site is protected by reCAPTCHA and the Google Privacy Policy and Terms of Service apply.

article thumbnail

Best 40+ Inventory KPIs and Metric Examples for Reporting

Jet Global

Inventory KPIs and metrics are crucial aspects of the reporting process. Inventory KPIs provide businesses with accurate information to make data-driven decisions. They help monitor inventory levels, track deliveries, and provide actionable insights about the efficiency of the warehouse or storage facilities. Reduce costs.

Metrics 52
article thumbnail

What is a Data Pipeline?

Jet Global

The key components of a data pipeline are typically: Data Sources : The origin of the data, such as a relational database , data warehouse, data lake , file, API, or other data store. This can include tasks such as data ingestion, cleansing, filtering, aggregation, or standardization.

article thumbnail

Mastering BI Dashboard Tools: Your Essential Guide

FineReport

Key Features of BI Dashboards: Customizable interface Interactivity Real-time data accessibility Web browser compatibility Predefined templates Collaborative sharing capabilities BI Dashboards vs. BI Reports: While both dashboards and reports are pivotal in business intelligence, they serve distinct purposes.

article thumbnail

Financial Dashboard: Definition, Examples, and How-tos

FineReport

Financial Performance Dashboard The financial performance dashboard provides a comprehensive overview of key metrics related to your balance sheet, shedding light on the efficiency of your capital expenditure. While sales dashboards focus on future prospects, accounting primarily focuses on analyzing the same metrics retrospectively.

article thumbnail

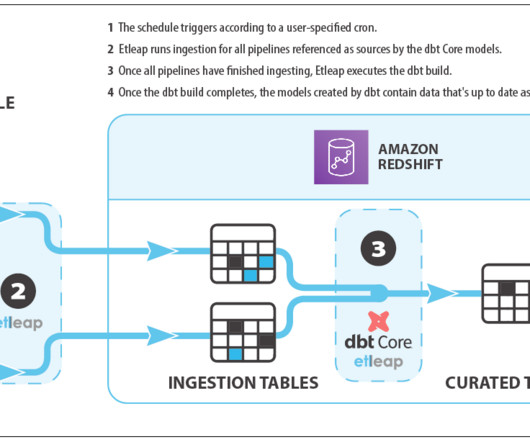
Configure end-to-end data pipelines with Etleap, Amazon Redshift, and dbt

AWS Big Data

Introduction to Amazon Redshift Amazon Redshift is a fast, fully-managed, self-learning, self-tuning, petabyte-scale, ANSI-SQL compatible, and secure cloud data warehouse. Thousands of customers use Amazon Redshift to analyze exabytes of data and run complex analytical queries.