Remove Data Integration Remove Data Warehouse Remove Forecasting Remove Metrics
article thumbnail

Enhance monitoring and debugging for AWS Glue jobs using new job observability metrics, Part 3: Visualization and trend analysis using Amazon QuickSight

AWS Big Data

In Part 2 of this series, we discussed how to enable AWS Glue job observability metrics and integrate them with Grafana for real-time monitoring. In this post, we explore how to connect QuickSight to Amazon CloudWatch metrics and build graphs to uncover trends in AWS Glue job observability metrics.

Metrics 110
article thumbnail

Financial Dashboard: Definition, Examples, and How-tos

FineReport

Financial Performance Dashboard The financial performance dashboard provides a comprehensive overview of key metrics related to your balance sheet, shedding light on the efficiency of your capital expenditure. Moreover, the software offers the convenient option of scheduling automated report delivery via email.

Insiders

Sign Up for our Newsletter

This site is protected by reCAPTCHA and the Google Privacy Policy and Terms of Service apply.

article thumbnail

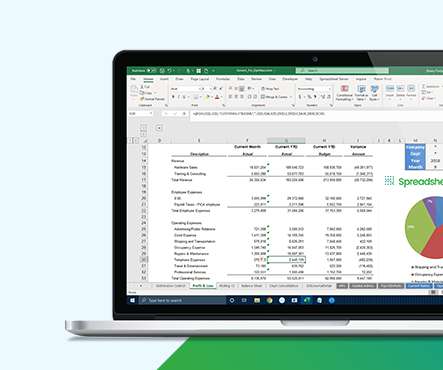
Five Key Questions to Help Speed JD Edwards Financial Reporting

Jet Global

While JD Edwards transactional data is required to run period close reports, analyze trends, and prepare forecasts for planning and budgeting, it comes with a lot of complexity. JD Edwards World has no less than 1600 tables of data to support just its business applications. non-financial) data in your financial reports?

article thumbnail

How HPE Aruba Supply Chain optimized cost and performance by migrating to an AWS modern data architecture

AWS Big Data

The application supports custom workflows to allow demand and supply planning teams to collaborate, plan, source, and fulfill customer orders, then track fulfillment metrics via persona-based operational and management reports and dashboards. The following diagram illustrates the solution architecture. 2 GB into the landing zone daily.

article thumbnail

How Amazon Devices scaled and optimized real-time demand and supply forecasts using serverless analytics

AWS Big Data

AWS Glue for ETL To meet customer demand while supporting the scale of new businesses’ data sources, it was critical for us to have a high degree of agility, scalability, and responsiveness in querying various data sources. This helped us automatically crawl the data from Amazon S3 and generate the schema and tables.

article thumbnail

Create an end-to-end data strategy for Customer 360 on AWS

AWS Big Data

The following figure shows some of the metrics derived from the study. Data ingestion You have to build ingestion pipelines based on factors like types of data sources (on-premises data stores, files, SaaS applications, third-party data), and flow of data (unbounded streams or batch data).

article thumbnail

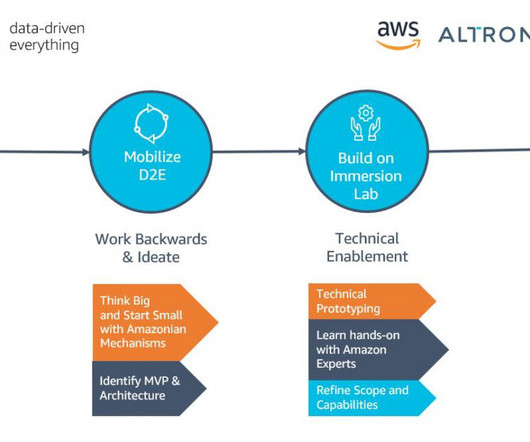
How AWS helped Altron Group accelerate their vision for optimized customer engagement

AWS Big Data

To verify the data quality of the sources through statistically-relevant metrics, AWS Glue Data Quality runs data quality tasks on relevant AWS Glue tables. He has been leading the building of data warehouses and analytic solutions for the past 20 years.