article thumbnail

Enhance monitoring and debugging for AWS Glue jobs using new job observability metrics: Part 2

AWS Big Data

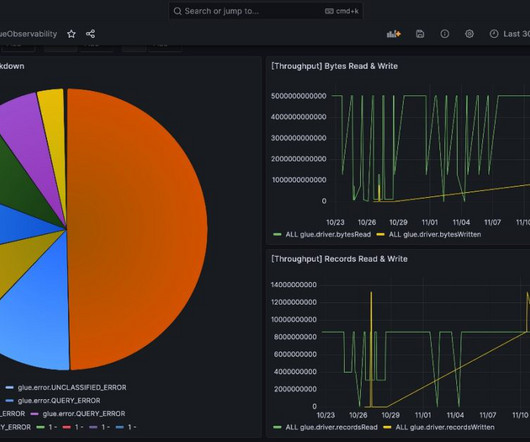
AWS Glue has made this more straightforward with the launch of AWS Glue job observability metrics , which provide valuable insights into your data integration pipelines built on AWS Glue. However, you might need to track key performance indicators across multiple jobs. Choose Add new data source.

Metrics 100
article thumbnail

Misled by metrics: 7 KPI mistakes IT leaders make

CIO Business Intelligence

Today, many CIOs feel the same way about metrics. Metrics are only as good as their source. Too often, technology companies pay consulting or analyst firms to create metrics based on the best characteristics of their offerings,” says Judith Hurwitz, CEO of Hurwitz Strategies, an emerging technology consulting firm.

Metrics 131
Insiders

Sign Up for our Newsletter

This site is protected by reCAPTCHA and the Google Privacy Policy and Terms of Service apply.

Trending Sources

article thumbnail

What is a KPI Report? Definition, Examples, and How-tos

FineReport

Key Performance Indicators (KPIs) serve as vital metrics that help measure progress towards business goals. To effectively monitor and analyze these metrics, businesses utilize KPI reports. Furthermore, additional metrics such as sales performance can be incorporated for customization.

KPI 52
article thumbnail

Welcome To The Digital Age: BI Meets Social Media

Smart Data Collective

The past decade integrated advanced analytics, data visualization, and AI into BI, offering deeper insights and trend predictions. Future BI tools emphasize real-time analytics, extensive data integration, and user-friendliness, redefining data use for competitive advantage in the digital age.

article thumbnail

What is Integrated Business Planning (IBP)?

IBM Big Data Hub

Data integration and analytics IBP relies on the integration of data from different sources and systems. This may involve consolidating data from enterprise resource planning (ERP) systems, customer relationship management (CRM) systems, supply chain management systems, and other relevant sources.

article thumbnail

Mastering BI Dashboard Tools: Your Essential Guide

FineReport

Key Features of BI Dashboards: Customizable interface Interactivity Real-time data accessibility Web browser compatibility Predefined templates Collaborative sharing capabilities BI Dashboards vs. BI Reports: While both dashboards and reports are pivotal in business intelligence, they serve distinct purposes.

article thumbnail

Financial Dashboard: Definition, Examples, and How-tos

FineReport

A financial dashboard, one of the most important types of data dashboards , functions as a business intelligence tool that enables finance and accounting teams to visually represent, monitor, and present financial key performance indicators (KPIs). It is generally advisable to maintain a quick ratio above 100%.