Remove Data Processing Remove Data-driven Remove Metadata Remove Visualization
article thumbnail

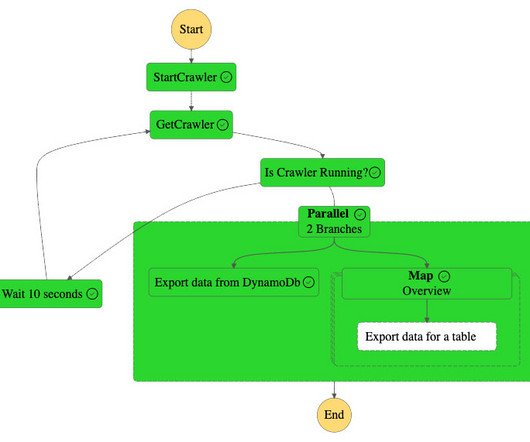
Enhance monitoring and debugging for AWS Glue jobs using new job observability metrics, Part 3: Visualization and trend analysis using Amazon QuickSight

AWS Big Data

QuickSight makes it straightforward for business users to visualize data in interactive dashboards and reports. You can slice data by different dimensions like job name, see anomalies, and share reports securely across your organization. CloudWatch streams metric data through a metric stream into Amazon Data Firehose.

Metrics 101
article thumbnail

The Ultimate Guide to Modern Data Quality Management (DQM) For An Effective Data Quality Control Driven by The Right Metrics

datapine

1) What Is Data Quality Management? 4) Data Quality Best Practices. 5) How Do You Measure Data Quality? 6) Data Quality Metrics Examples. 7) Data Quality Control: Use Case. 8) The Consequences Of Bad Data Quality. 9) 3 Sources Of Low-Quality Data. 10) Data Quality Solutions: Key Attributes.

Insiders

Sign Up for our Newsletter

This site is protected by reCAPTCHA and the Google Privacy Policy and Terms of Service apply.

article thumbnail

Modernize your ETL platform with AWS Glue Studio: A case study from BMS

AWS Big Data

In addition to using native managed AWS services that BMS didn’t need to worry about upgrading, BMS was looking to offer an ETL service to non-technical business users that could visually compose data transformation workflows and seamlessly run them on the AWS Glue Apache Spark-based serverless data integration engine.

article thumbnail

Business Intelligence for Fairs, Congresses and Exhibitions

Smart Data Collective

Advancement in big data technology has made the world of business even more competitive. The proper use of business intelligence and analytical data is what drives big brands in a competitive market. Business intelligence tools can include data warehousing, data visualizations, dashboards, and reporting.

article thumbnail

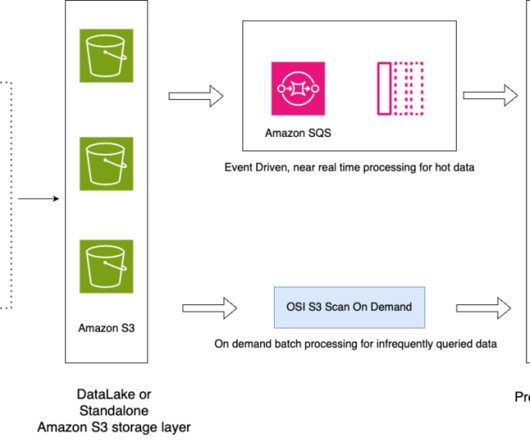
Petabyte-scale log analytics with Amazon S3, Amazon OpenSearch Service, and Amazon OpenSearch Ingestion

AWS Big Data

Organizations often need to manage a high volume of data that is growing at an extraordinary rate. At the same time, they need to optimize operational costs to unlock the value of this data for timely insights and do so with a consistent performance. We think of this concept as inside-out data movement. Example Corp.

Data Lake 109
article thumbnail

The Top Three Entangled Trends in Data Architectures: Data Mesh, Data Fabric, and Hybrid Architectures

Cloudera

Data teams have the impossible task of delivering everything (data and workloads) everywhere (on premise and in all clouds) all at once (with little to no latency). Each of these trends claim to be complete models for their data architectures to solve the “everything everywhere all at once” problem. Data mesh defined.

article thumbnail

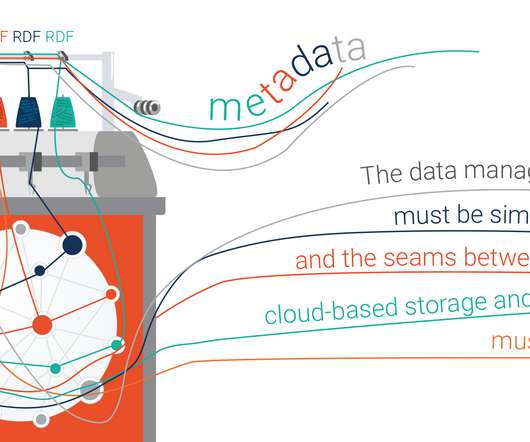
From Data Silos to Data Fabric with Knowledge Graphs

Ontotext

What Makes a Data Fabric? Data Fabric’ has reached where ‘Cloud Computing’ and ‘Grid Computing’ once trod. Data Fabric hit the Gartner top ten in 2019. This multiplicity of data leads to the growth silos, which in turns increases the cost of integration. It is a buzzword.