article thumbnail

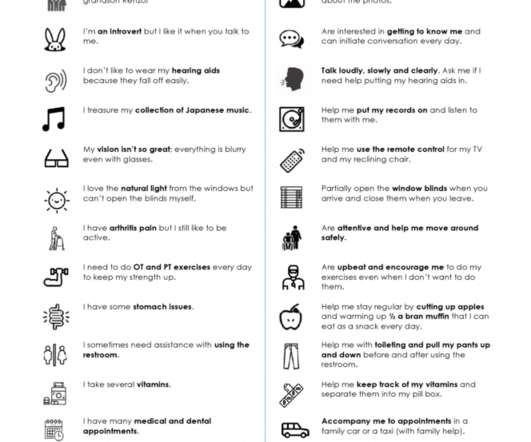
Humanity in Data Visualization: Designing a One-Pager for My Grandma’s Caregivers

Depict Data Studio

I also had the good fortune of attending some of Ann’s in-person presentations about data visualization at a conference for Continuous Quality Improvement hosted by the California Department of Social Services, which had an unquantifiable impact on the personal project I will be sharing with you today. Download the One-Pager.

article thumbnail

How to Influence Others with Your Data: SuperDataScience Podcast Interview

Depict Data Studio

How do we overcome common pain points in data visualization and storytelling?? What’s the most important thing to keep in mind while editing our visualizations??? I recently discussed all these, and more, on the SuperDataScience podcast with the host, Jon Krohn. Download it here. What an honor!

Insiders

Sign Up for our Newsletter

This site is protected by reCAPTCHA and the Google Privacy Policy and Terms of Service apply.

Trending Sources

article thumbnail

Your Definitive Guide To Building Valuable Narratives Through Data Storytelling

datapine

By gaining centralized access to business data and presenting it in a visual way that follows a logical path and provides invaluable insights on a particular area or subject, you stand to set yourself apart from your competitors and become a leader in your field. Download our free executive summary and start creating your stories!

KPI 193
article thumbnail

Top 14 Must-Read Data Science Books You Need On Your Desk

datapine

Download our free guide! This interdisciplinary field of scientific methods, processes, and systems helps people extract knowledge or insights from data in a host of forms, either structured or unstructured, similar to data mining. Download our free guide! Exclusive Bonus Content: The top books on data science summarized!

article thumbnail

Monetizing Analytics Features: Why Data Visualizations Will Never Be Enough

Think your customers will pay more for data visualizations in your application? But today, dashboards and visualizations have become table stakes. Five years ago they may have. Discover which features will differentiate your application and maximize the ROI of your embedded analytics. Brought to you by Logi Analytics.

article thumbnail

Utilize The Effectiveness Of Professional Executive Dashboards & Reports

datapine

Download our guide to boost your business efforts and jump to success! Modern executive reporting consolidates key business metrics while outlining problems and solutions in which KPI dashboards are used to provide additional insights and serve as an added visual representation that usually lacks in executive reports and summaries.

article thumbnail

Get Started With Business Performance Dashboards – Examples & Templates

datapine

Download our pocket-sized summary and improve your operations! A performance dashboard is a data visualization tool that offers a wealth of knowledge on invaluable insights, enabling the user to gain a deeper understanding of their business’s performance in a number of areas while making valuable decisions that foster growth.