article thumbnail

Your Ultimate Guide To Modern KPI Reports In The Digital Age – Examples & Templates

datapine

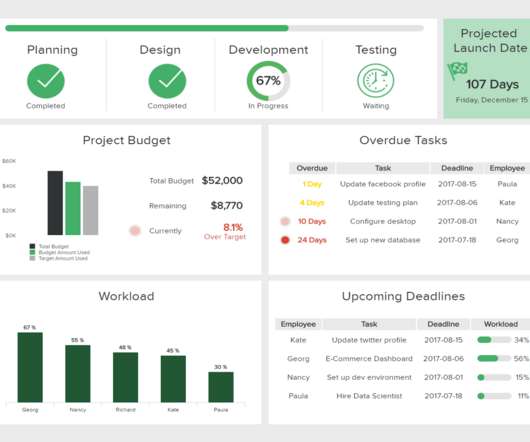
Typically presented in the form of an interactive dashboard , this kind of report provides a visual representation of the data associated with your predetermined set of key performance indicators – or KPI data, for short. Pick a couple of indicators that will track and assess the performance.

KPI 223
article thumbnail

Your Introduction To CFO Dashboards & Reports In The Digital Age

datapine

Serving as a central, interactive hub for a host of essential fiscal information, CFO dashboards host dynamic financial KPIs and intuitive analytical tools, as well as consolidate data in a way that is digestible and improves the decision-making process. CFO dashboard KPIs offer a digestible visual representation of what matters most.

Insiders

Sign Up for our Newsletter

This site is protected by reCAPTCHA and the Google Privacy Policy and Terms of Service apply.

article thumbnail

An Introduction To Data Dashboards: Meaning, Definition & Industry Examples

datapine

Data dashboards provide a centralized, interactive means of monitoring, measuring, analyzing, and extracting a wealth of business insights from relevant datasets in several key areas while displaying aggregated information in a way that is both intuitive and visual. Lack of different data visualization types.

article thumbnail

Your Definitive Guide To Building Valuable Narratives Through Data Storytelling

datapine

By gaining centralized access to business data and presenting it in a visual way that follows a logical path and provides invaluable insights on a particular area or subject, you stand to set yourself apart from your competitors and become a leader in your field. Data storytelling has a host of business-boosting benefits.

KPI 193
article thumbnail

Best Dashboard Ideas & Design Examples To Boost Your Business Success

datapine

The ability to monitor, visualize, and analyze relevant data gives today’s businesses, across a host of sectors, the power to understand their prospects, make informed decisions, increase efficiencies, and work towards a set of rewarding long term goals. Best Dashboard Ideas You Can Get Inspiration From. click to enlarge**.

article thumbnail

SaaS Dashboard Examples For Modern Business Management Practices

datapine

A SaaS dashboard is a powerful business intelligence tool that offers a host of benefits for ambitious tech businesses. Our executive SaaS dashboard template is interactive, intuitive, and features a balanced mix of KPIs that help with the successful management of all key software-as-a-service business departments, functions, and processes.

article thumbnail

Your Complete Guide To Creating Professional TV Dashboards

datapine

Data is most effective when it’s visual, easy to analyze, and accessible to everyone in the organization. Typically displayed on a wall, TV dashboards offer a visual representation of real-time data that’s relevant to a particular department, strategy, or initiative. What Is A TV Dashboard? ” – Benjamin Franklin.