Remove Data Processing Remove Key Performance Indicator Remove Metrics Remove Visualization
article thumbnail

Your Introduction To CFO Dashboards & Reports In The Digital Age

datapine

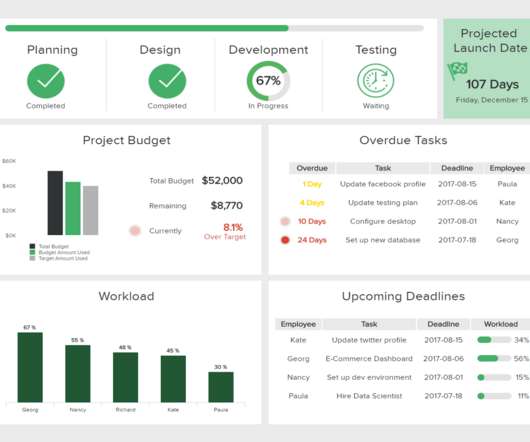
Serving as a central, interactive hub for a host of essential fiscal information, CFO dashboards host dynamic financial KPIs and intuitive analytical tools, as well as consolidate data in a way that is digestible and improves the decision-making process. Top 7 CFO Dashboard KPIs & Metrics Explained. What Is A CFO Dashboard?

article thumbnail

Your Ultimate Guide To Modern KPI Reports In The Digital Age – Examples & Templates

datapine

Typically presented in the form of an interactive dashboard , this kind of report provides a visual representation of the data associated with your predetermined set of key performance indicators – or KPI data, for short. Pick a couple of indicators that will track and assess the performance.

KPI 223
Insiders

Sign Up for our Newsletter

This site is protected by reCAPTCHA and the Google Privacy Policy and Terms of Service apply.

article thumbnail

SaaS Dashboard Examples For Modern Business Management Practices

datapine

A SaaS dashboard is a powerful business intelligence tool that offers a host of benefits for ambitious tech businesses. Moreover, as a SaaS metrics dashboard serves all of your data in one centralized space, you don’t need to waste time logging into different applications or platforms to source the insights you need. 2) Vision.

article thumbnail

How To Improve Your Facility Management With Healthcare Reports

datapine

Like many of today’s most important industries, digital data, metrics and KPIs (key performance indicators) are a part of a bright and prosperous future – and a comprehensive healthcare report has the power to deliver in each of these critical areas. The Benefits Of A Healthcare Report. Preventative management.

Reporting 198
article thumbnail

Utilize The Effectiveness Of Professional Executive Dashboards & Reports

datapine

By gaining the ability to gather, organize and analyze the metrics that are most important to your organization, you stand to make your business empire more intelligent than ever before – and executive reporting and business dashboards will help you do just that. 90% of the information transmitted to the brain is visual.

article thumbnail

Best Dashboard Ideas & Design Examples To Boost Your Business Success

datapine

The ability to monitor, visualize, and analyze relevant data gives today’s businesses, across a host of sectors, the power to understand their prospects, make informed decisions, increase efficiencies, and work towards a set of rewarding long term goals. Best Dashboard Ideas You Can Get Inspiration From. click to enlarge**.

article thumbnail

Designing Charts and Graphs: How to Choose the Right Data Visualization Types

datapine

Modern dashboard software makes it simpler than ever to merge and visualize data in a way that’s as inspiring as it is accessible. Knowing what story you want to tell (analyzing the data) tells you which data visualization type to use. Let’s assume you have the right data and the right data visualization software. Distribution.