article thumbnail

Accelerate change with Value Stream Management

CIO Business Intelligence

VSM is very much driven by digital transformation. Whether it’s a very strategic, top-down transformation initiative, a bottom-up effort to scale a successful pilot, or something in between – every organization is recognizing the need to change the way they operate in order to create and deliver customer value more effectively.

article thumbnail

How Novanta’s CIO mobilized its data-driven transformation

CIO Business Intelligence

My team and I are very proud of our transformation that started in 2019,” she says. So we have a visualization layer where we teach different groups within our organization to learn. They’re learning how to visualize data on their own, so they don’t really need IT other than the data marts in order to build their own dashboards.

Insiders

Sign Up for our Newsletter

This site is protected by reCAPTCHA and the Google Privacy Policy and Terms of Service apply.

Trending Sources

article thumbnail

Project Dashboard: Drive You To The Business Success

FineReport

The assistance specifically shows in the following aspects: The dashboard uses data visualization to track key project indicators. It provides meaningful references for the team and helps the team generate actionable insights, transforming the acquired information into actions. Free trial. Representative project dashboard software.

article thumbnail

Belcorp reimagines R&D with AI

CIO Business Intelligence

Furthermore, we succinctly conveyed the platform’s value and benefits to the end-users through a series of workshops and demos, thus ensuring the platform’s adoption.” Not only has the project delivered on expected results, Gopalan says it has also led to the digital transformation of R&D. Reimagine business processes.

article thumbnail

Crafting a Knowledge Graph: The Semantic Data Modeling Way

Ontotext

The W3C has dedicated a special workshop to talk through the different approaches to building these big data structures. Start delivering the answers to your original questions through different knowledge discovery tools such as SPARQL queries, semantic search, faceted search, data visualization, etc. Make your KG easy to maintain.

article thumbnail

How SikSin improved customer engagement with AWS Data Lab and Amazon Personalize

AWS Big Data

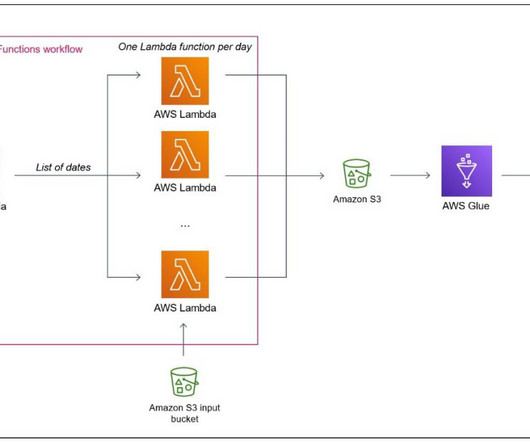
The SikSin team used AWS Step Functions Workflow Studio to visually create, run, and debug workflow runs. AWS Glue DataBrew is a visual data preparation tool that makes it easy for data analysts and data scientists to clean and normalize data to prepare it for analytics and ML. This workflow is triggered based on a schedule.

article thumbnail

Extract time series from satellite weather data with AWS Lambda

AWS Big Data

Configure the Step Functions workflow After you create the two Lambda functions, you can design the Step Functions workflow in the visual editor by using the Lambda Invoke and Map blocks, as shown in the following diagram. On the AWS Glue Studio console, create a new job and choose Visual with a blank canvas. Add a data source block.