Remove Enterprise Remove Interactive Remove KPI Remove Visualization
article thumbnail

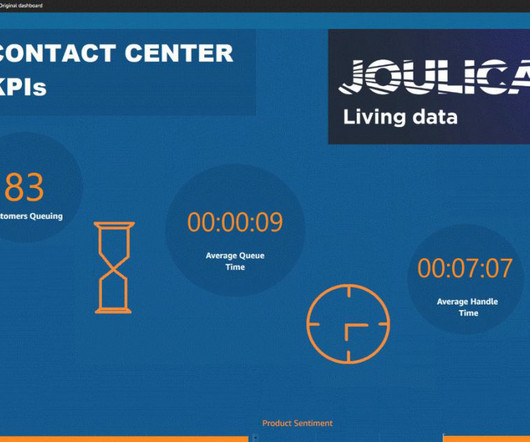
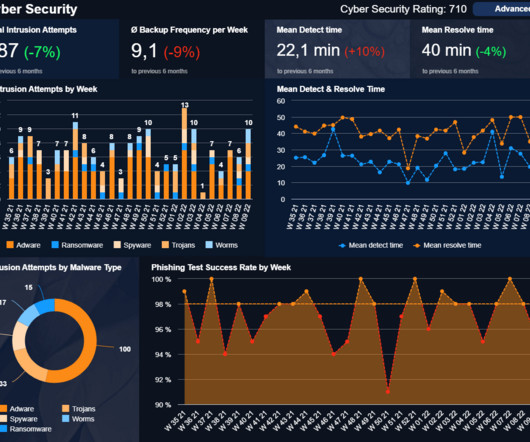
KPI Dashboard: Keys To Achieve Better Performance
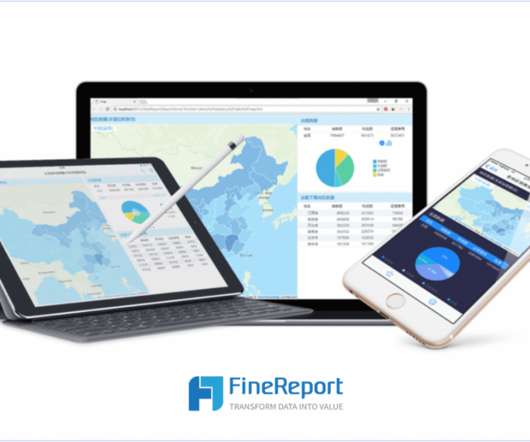
FineReport

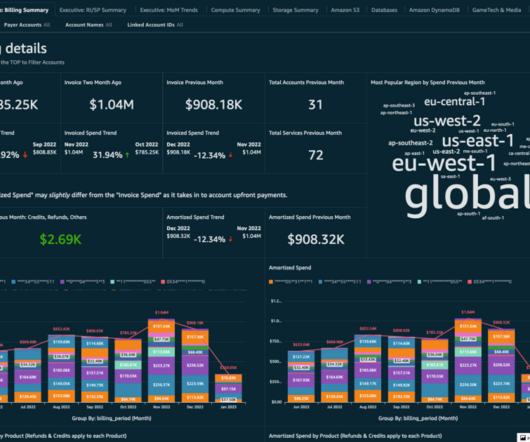
KPI dashboard releases you from your worries and troubles. What is a KPI dashboard? Definition of KPI dashboard. KPIs (Key performance indicators) are quantitative indicators used to measure the work performance of staff, being the foundation of an enterprise performance management system.

KPI 52
article thumbnail

BI Visualization Tools: Top 5 Picks 2021

FineReport

Nowadays, almost all businesses from all works believe in the potential of excellent BI tools to create stunning visualizations and effectively convey business information. There are many BI tools on the market that have potentially efficient visualization capabilities for customers to use. What are BI Visualization Tools?

Insiders

Sign Up for our Newsletter

This site is protected by reCAPTCHA and the Google Privacy Policy and Terms of Service apply.

Trending Sources

article thumbnail

Why Dashboard Visualization Matters in the 21st century?

FineReport

Data dashboard visualization plays a key role in business, whether about analysis or decision. It empowers every user to understand complex data in a visual way. Now, let’s explore the dashboard visualization! What is Dashboard Visualization? dashboard visualization (by Finereport?. Just a link to their dashboards!

article thumbnail

SaaS Dashboard Examples For Modern Business Management Practices

datapine

The additional features provide access from mobile phones, tablets, and laptops so you can access your information and selected SaaS KPIs anytime, any place. Compiling analysis results with the help of interactive dashboards and charts is one of the main features SaaS solution can offer. A SaaS KPI dashboard will help you do just that.

article thumbnail

Discover Powerful Small Business Dashboards & KPIs To Track For Success

datapine

2) What Are Small Business KPIs? 4) Small Business Dashboard & KPIs Examples. The times were data analysis was segregated to big enterprises that had the necessary resources to carry it out are long gone. Powered by data visualizations, small businesses can use them to track performance and ensure steady growth.

article thumbnail

Take Advantage Of The Top 16 Sales Graphs And Charts To Boost Your Business

datapine

It tells you how many new customers you’ve gotten this year, how much revenue each one of those customers is driving, and how much each of those customers costs to acquire – along with many other useful sales KPIs. This gives to that sales graph an overall sense of visual contrast which makes it much more digestible at a glance.

Sales 235
article thumbnail

What Is Dashboard—Definition, Purposes and Examples

FineReport

Actually, it, to be specific, is a type of graphical user interface that often offers intelligent views of key performance indicators (KPIs) related to certain objectives or business processes. The tool is also a kind of “report” with a form of data visualization. KPI dashboard. KPI Dashboard (From FineReport?.