article thumbnail

KPI Dashboard: Keys To Achieve Better Performance

FineReport

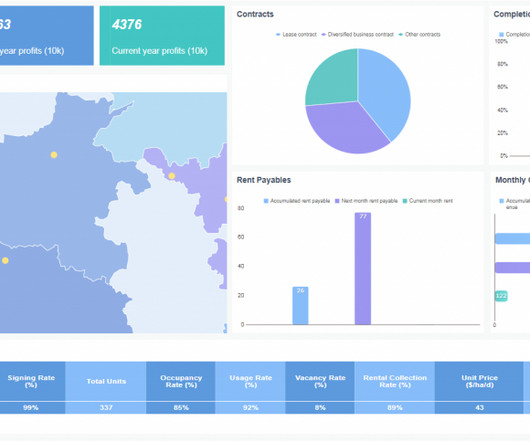
KPI dashboard releases you from your worries and troubles. What is a KPI dashboard? Definition of KPI dashboard. KPIs (Key performance indicators) are quantitative indicators used to measure the work performance of staff, being the foundation of an enterprise performance management system. Reality Use of KPI Dashboard.

KPI 52
article thumbnail

Three predictions for AI and automation business adoption

CIO Business Intelligence

With FutureIT Los Angeles coming up on March 12, we asked event speaker Maureen Fleming, Program Vice President at IDC, to discuss her top three predictions for AI and automation business adoption. In DevOps, KPIs may be improvements in software quality or time to value. You’re not reinventing KPIs for AI,” said Fleming.

Insiders

Sign Up for our Newsletter

This site is protected by reCAPTCHA and the Google Privacy Policy and Terms of Service apply.

article thumbnail

How To Improve Your Facility Management With Healthcare Reports

datapine

By utilizing interactive digital dashboards, it’s possible to leverage data to transform metrics into actionable insights to spot weaknesses, identify strengths, and predict events before they occur. Hospital KPI dashboard. Main hospital dashboard KPIs. This, in turn, will enhance the success of your institution.

Reporting 198
article thumbnail

How to achieve Kubernetes observability: Principles and best practices

IBM Big Data Hub

Logs Logs include discrete events recorded every time something occurs in the system, such as status or error messages, or transaction details. With so many shifting, interacting and layered components comes as many potential issues and failure points, therefore lots of areas where real-time monitoring becomes a necessity.

Metrics 66
article thumbnail

Joulica unifies real-time and historical customer experience analytics with Amazon QuickSight

AWS Big Data

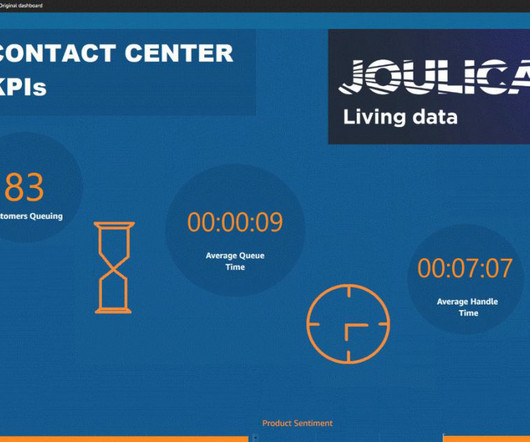
Our platform delivers real-time and historical analytics across the wide variety of data sources and customer interaction channels that are now common in most organizations. Our customer journey analytics go beyond typical contact center reporting, and stitches together how customers interact with organizations across channels.

article thumbnail

Exploring real-time streaming for generative AI Applications

AWS Big Data

For example, in a chatbot, data events could pertain to an inventory of flights and hotels or price changes that are constantly ingested to a streaming storage engine. Furthermore, data events are filtered, enriched, and transformed to a consumable format using a stream processor.

article thumbnail

Utilize The Undeniable Power Of Professional COO Dashboards & Reports

datapine

That’s why using a modern dashboard tool is vital for monitoring and analyzing multiple touchpoints and presenting data in real-time, visually, and with strong interactivity levels so any operational activity can’t be left unnoticed. That said, in essence, we will discuss: What is a COO dashboard? What is a COO report?