article thumbnail

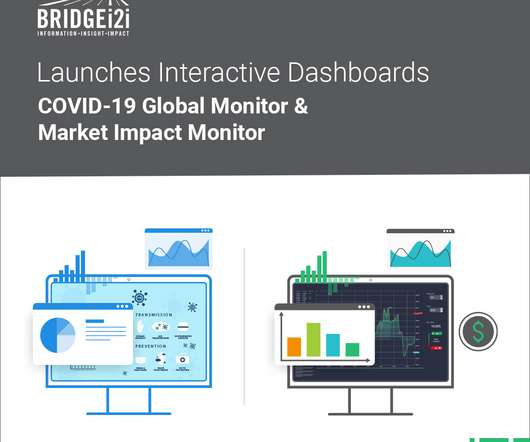
BRIDGEi2i launches two interactive dashboards: COVID19 Global Monitor & COVID Stock Market Impact Monitor

bridgei2i

The Global COVID-19 Monitor gives live insights on the spread of the pandemic across the world and allows you to slice and dice data from many perspectives. Compared with other outbreaks, COVID19 is seen to have an unparalleled impact on the US markets, and as a consequence, market volatility has increased around the world.

article thumbnail

Simplify Metrics on Apache Druid With Rill Data and Cloudera

Cloudera

Co-author: Mike Godwin, Head of Marketing, Rill Data. Cloudera users can securely connect Rill to a source of event stream data, such as Cloudera DataFlow , model data into Rill’s cloud-based Druid service, and share live operational dashboards within minutes via Rill’s interactive metrics dashboard or any connected BI solution.

Metrics 85
Insiders

Sign Up for our Newsletter

This site is protected by reCAPTCHA and the Google Privacy Policy and Terms of Service apply.

Trending Sources

article thumbnail

How to Streamline Yardi Financial Reporting

Jet Global

Rapidly changing occupancy patterns, volatility in the economy, and tightening liquidity are forcing real estate professionals to remain agile – keeping a close watch on cash flow, maintaining good relationships with lenders, and closely monitoring external factors that impact the real estate market.

article thumbnail

Ten Hidden Gems In Google Analytics: Do Smarter Web Data Analysis!

Occam's Razor

Affinity & In-Market Segments: Understand Your People Better. Assisted Conversions: Smarter Marketing Impact Attribution. Affinity & In-Market Segments: Understand Your People Better. Once I know these two answers, I can take quick action to unleash some of my precious marketing dollars in the right place.

Analytics 155
article thumbnail

13 power tips for Microsoft Power BI

CIO Business Intelligence

If you use Xero for accounting, or K2 Cloud to build business processes, or Adobe Marketing Cloud, SAP HANA, Salesforce, MailChimp, Marketo, or Google Analytics, you can use Power BI to visualize the data you have in those services, perform calculations, create reports, and bring them together in a custom dashboard.

article thumbnail

How Newcomp Analytics partners with IBM to advance clients’ supply chain insights

IBM Big Data Hub

IBM has the best channel ecosystem in the market today… it’s like a well-oiled machine. Lindt has used Cognos Analytics for more than 20 years as an analytics solution for its sales and marketing functions. They are the standard to which we hold all other vendors.”.

article thumbnail

Accelerating revenue growth with real-time analytics: Poshmark’s journey

AWS Big Data

The two main approaches organizations employ to increase revenue are to expand geographically to enter new markets and to increase market share within a market by improving customer experience (CX). Improving CX is a well-known guideline to attract and retain customers and thereby increase the market share.