article thumbnail

Master Data Visualization Techniques: A Comprehensive Guide

FineReport

Applications in Various Fields In Business , data visualization is used for sales analysis , market forecasting, and performance KPI tracking. Education benefits from data visualization by enhancing learning experiences through interactive visual aids.

article thumbnail

Top Data Science Tools That Will Empower Your Data Exploration Processes

datapine

The use of machine learning, predictive analytics, and various data connectors that enable the user to work with enormous amounts of databases, flat files, marketing analytics, CRM, etc., The example above shows us a visual of the drag and drop interface created in datapine for a 6 months forecast based on past and current data.

Insiders

Sign Up for our Newsletter

This site is protected by reCAPTCHA and the Google Privacy Policy and Terms of Service apply.

Trending Sources

article thumbnail

Analytics Technology Redefines Social Media Marketing in Sports

Smart Data Collective

We will also cover some of the changes brought on by data analytics. Increased Fan Engagement Social media platforms have become the go-to destination for sports fans seeking instantaneous updates and real-time interactions.

article thumbnail

Join me at Live! 360 Orlando to learn more about Applied Business Analytics

Jen Stirrup

Analytics for Sales – what numbers do they need on a sales dashboard, why, and what do they say? In this session, we will look at common sales scenarios for analytics such as forecasting and ‘what if’ scenarios, and how they can be implemented with the Microsoft Data Platform. One important area in data is marketing.

article thumbnail

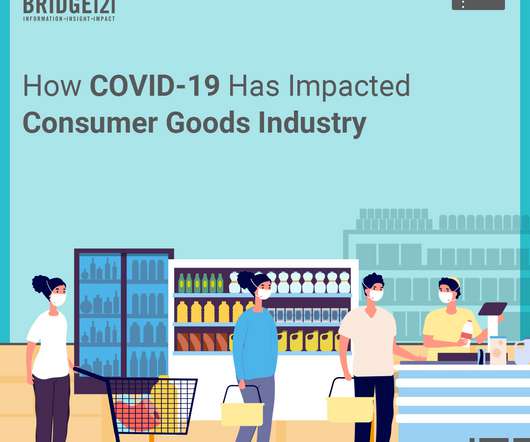
How COVID-19 Has Impacted Consumer Goods Industry

bridgei2i

Demand for minimal physical interaction/low human touch products: Due to the risk of infection, customers want to pick up products with minimal human contact. Forecasting models have to be created keeping in mind this uncertainty, and key indicators need to be identified for early detection.

article thumbnail

PODCAST: COVID19 | Redefining Digital Enterprises – Episode 11: The Impact of COVID-19 on Consumer Packaged Goods Industry

bridgei2i

Therefore, together, from a supply-side perspective, it is becoming extremely difficult for CPG companies to forecast and plan. Also, Melita, planning, and forecasting, as I spoke about this earlier, is becoming a huge challenge. Retailers are asking for deliveries within one or one and a half days.

article thumbnail

5 Sources of Data for Customer Analytics and Their Benefits

Smart Data Collective

Data analytics can assist you in figuring out why people abandon your brand or prefer alternative products instead. Predictive analytics, which analyses historical activities to uncover trends and forecast a specific event, can also predict if a customer is ready to churn or defect. Customer Lifetime Analytics.