

How to Visualize Confidence Intervals in Presentation Slides
Depict Data Studio
OCTOBER 30, 2023
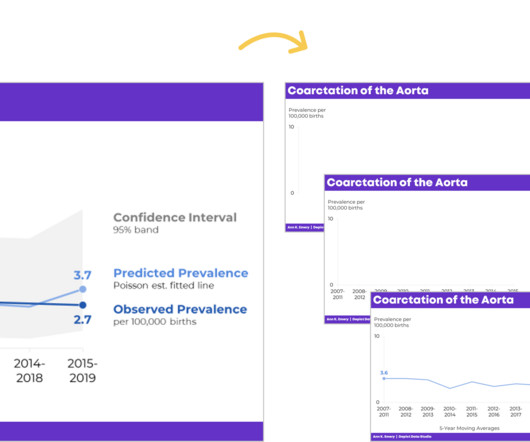
In this blog post, you’ll learn how to explain dense graphs one slide at a time, which makes it easier for our audience to follow along. ” Finally, I’d click, move to the next slide, and say, “Here’s the confidence interval with a 95% band.” Do you need to share statistics in presentations?


Let's personalize your content