Remove Information Remove Metrics Remove Reporting Remove Slice and Dice
article thumbnail

12 Marketing Reports Examples You Can Use For Annual, Monthly, Weekly And Daily Reporting Practice

datapine

Today’s digital data has given the power to an average Internet user a massive amount of information that helps him or her to choose between brands, products or offers, making the market a highly competitive arena for the best ones to survive. But first, we will start with a basic definition and some tips on creating these kinds of reports.

Reporting 280
article thumbnail

Move Beyond Excel, PowerPoint And Static Business Reporting with Powerful Interactive Dashboards

datapine

Soon businesses of all sizes will have so much amount of information that dashboard software will be the most invaluable resource a company can have. Interactive Dashboards vs. Static Reporting. Gone are the days of static presentations, stagnate reports, and waiting on analysts to pull reports and then having out-of-date data.

Insiders

Sign Up for our Newsletter

This site is protected by reCAPTCHA and the Google Privacy Policy and Terms of Service apply.

Trending Sources

article thumbnail

13 power tips for Microsoft Power BI

CIO Business Intelligence

With Power BI, you can pull data from almost any data source and create dashboards that track the metrics you care about the most. Power BI’s rich reports or dashboards can be embedded into reporting portals you already use. But with Power BI, you can simply drag a slider bar to show the impact of changes.

article thumbnail

The Indian Business Responsibility and Sustainability Report (BRSR) explained

IBM Big Data Hub

India’s Business Responsibility and Sustainability Report (BRSR)—a framework for environmental, social and governance (ESG) reporting—comes into effect in 2023. General disclosures encompass basic company information.

article thumbnail

5 tips for excelling at self-service analytics

CIO Business Intelligence

Data-informed decision-making is a key attribute of the modern digital business. One potential solution to this challenge is to deploy self-service analytics, a type of business intelligence (BI) that enables business users to perform queries and generate reports on their own with little or no help from IT or data specialists.

Analytics 130
article thumbnail

How Model Observability Provides a 360° View of Models in Production

DataRobot Blog

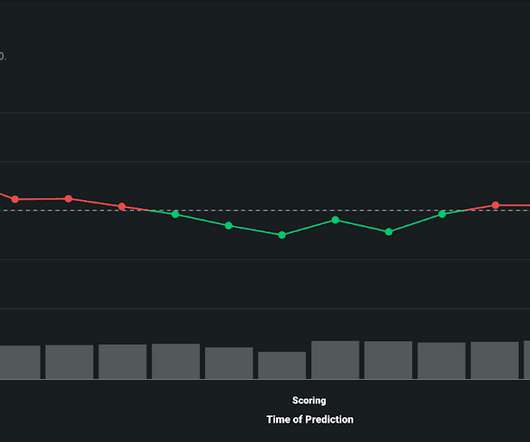
By tracking service, drift, prediction data, training data, and custom metrics, you can keep your models and predictions relevant in a fast-changing world. A myriad of issues can interfere with the performance and delivery of production models, resulting in poor or incomplete predictions and ill-informed decision-making.

article thumbnail

Embedded BI Can Encourage Data Literacy!

Smarten

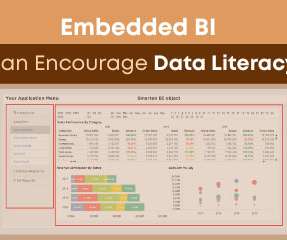
Embedded BI and Augmented Analytics includes traditional BI components like dashboards, KPIs, Reports with interactive drill-down, drill through, slice and dice and self-serve analytics capabilities.