article thumbnail

DirectX Visualization Optimizes Analytics Algorithmic Traders

Smart Data Collective

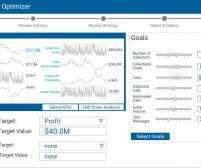
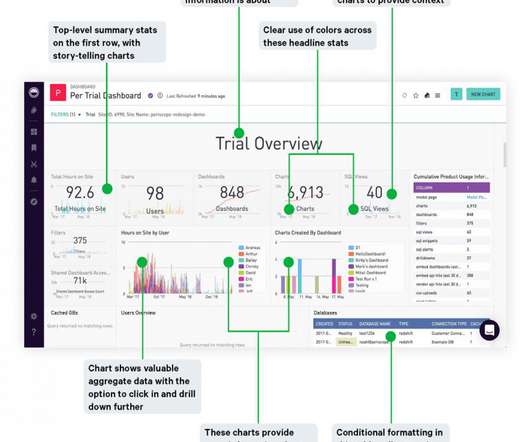
Learn how DirectX visualization can improve your study and assessment of different trading instruments for maximum productivity and profitability. Luckily, there are a few analytics optimization strategies you can use to make life easy on your end. So, how can DirectX visualization improve your analytics and testing as a trader?

article thumbnail

Remove Your Rose Tinted Glasses: Data Visualizations Designed to Mislead

datapine

1) Misleading Data Visualization Examples. 2) How to Avoid Misleading Visuals. 3) The Impact Of Bad Data Visualizations. But while that may be the case, people are duped by data visualizations every day. Bad data visualizations come in many forms, with some more obvious than others. Table of Contents.

Insiders

Sign Up for our Newsletter

This site is protected by reCAPTCHA and the Google Privacy Policy and Terms of Service apply.

article thumbnail

Master Data Visualization Techniques: A Comprehensive Guide

FineReport

Data visualization techniques are paramount in today’s data-driven world. Mastering data visualization techniques is not just a skill but a necessity for professionals across various industries. Definition and Importance Visualizing data involves representing information through graphical elements like charts and graphs.

article thumbnail

Revolutionizing data querying: Amazon Redshift and Visual Studio Code integration

AWS Big Data

Amazon Redshift recently announced integration with Visual Studio Code (), an action that transforms the way data practitioners engage with Amazon Redshift and reshapes your interactions and practices in data management. Traditionally, they had to use QE v2 for their development tasks, which wasn’t the most optimal solution.

article thumbnail

Exploring Data Wonders: Data Visualization Examples & Considerations

FineReport

As the realm of data visualization undergoes rapid proliferation, diversifying applications, and evolving presentation formats, its expansive landscape unfolds. Mirroring the growth seen in other emerging concepts, the boundaries of data visualization remain in a state of continual expansion and is vital when you generate reports.

article thumbnail

From Raw Data to Visualization: Marvel Social Graph Analysis

Smart Data Collective

Marvel is one of the many companies using big data to optimize its business model. What’s amazing is that Marvel characters are developed through the influence of other Marvel heroes through data visualization. For instance, when Spider-Man appears in a comic book with Captain America, these are all visualized through data graphics.

article thumbnail

Smart Data Visualization Presents a Clear Picture of Data!

Smarten

Smart Data Visualization Tells a ‘Story’ and Provides Data Insight! No matter how or why you are using data, the presentation of that data, and the ability to provide flexible visualization and reporting can dramatically change your outcome. Finding the insight and the all-important ‘nuggets’ of information is critical to success.