article thumbnail

Faster data exploration in Jupyter through Lux

Domino Data Lab

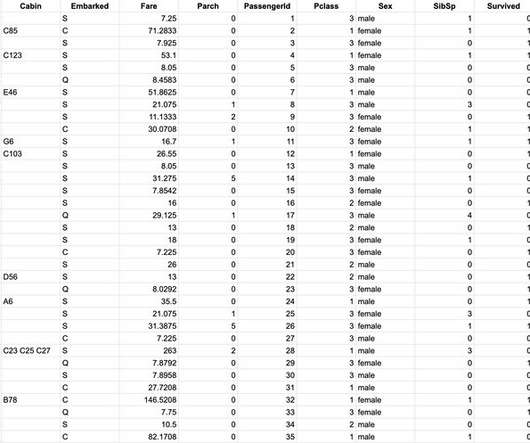
Lux is a Jupyter library integrated with an interactive widget that automates the generation of data visualizations from inside a notebook. This allows data scientists to quickly browse through a series of visualizations to seek out correlations and interesting trends. Saving visualizations in Lux. df.exported. Conclusion.

article thumbnail

6 Principles to Make your Data Story Stick

Juice Analytics

Check it out… S imple Strip an idea down to its core Old-school dashboards have a prime directive: show all the information on one page. This is the (Juicebox) Way: We encourage and enable visually strong titles, big bold images, and fully-width color. Don’t start with a wall of charts. Bring personality to your data presentation.

Insiders

Sign Up for our Newsletter

This site is protected by reCAPTCHA and the Google Privacy Policy and Terms of Service apply.

Trending Sources

article thumbnail

Reporting Analytics vs. Financial Reporting: Is There a Difference?

Jet Global

Here’s an overview of the key differences between the two, as well as some tips on how the finance team at your company can use information to help your business achieve strategic and tactical advantage. Financial Reporting. The content and layout of financial reports may also vary considerably depending on their intended audience.

article thumbnail

The Bite-Size Future of Business Intelligence

Paul Blogs on BI

So at IBIS 2021 last month, there was a fascinating discussion on the Future of data visualization, artificial intelligence and machine learning in Business Intelligence with two BI visionaries from Tableau, Santi Becerra and Caroline Sherman. To these recipients of actionable pieces of information, this is self-service BI.

article thumbnail

Sisense Q4 2020: Analytics for Every User With AI-Powered Insights

Sisense

Often, to find those types of insights, you slice, dice, and filter. As another example, if your sales went up by 10%, Sisense might explain that the increase was attributable to both a specific product category and a certain age group of customer with a visual display of the breakdown.

article thumbnail

Business Intelligence for Marketing: Offer Efficient Work

FineReport

BI tools will offer all the needed data to provide useful information and help assess and prepare marketing for marketing teams. Marketing data visualization display(by FineReport). In a word, BI helps the company to scrutinize the its own data and consider all the external business information. BI tools for marketing.

article thumbnail

5 tips for excelling at self-service analytics

CIO Business Intelligence

Data-informed decision-making is a key attribute of the modern digital business. Self-service enables all functions, including operations, finance, procurement, supply chain, and continuous improvement teams, to perform data discovery and create powerful visualizations. “We Data can be derived from multiple sources in various formats.”

Analytics 137