
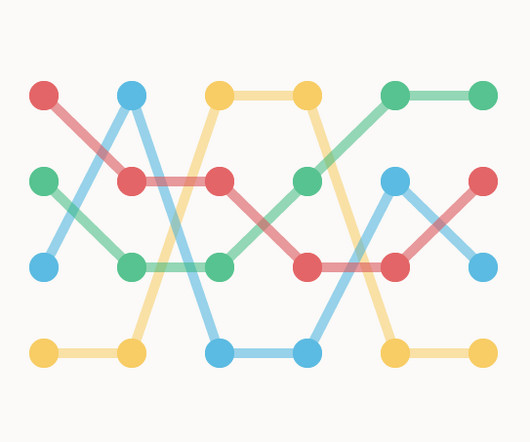
Chart Snapshot: Bump Charts
The Data Visualisation Catalogue
MAY 13, 2024
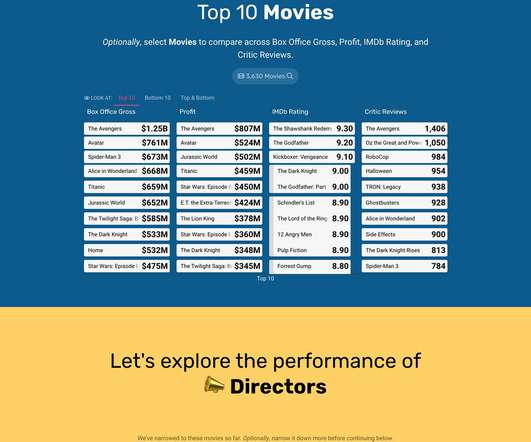
Interactive development & interaction design by Julia Janicki. FLOWINGDATA / Nathan Yau The post Chart Snapshot: Bump Charts appeared first on The Data Visualisation Catalogue Blog. Colour is often used to distinguish each category. Tools to create this chart with: D3.js The World’s Most Innovative Countries.


Let's personalize your content