Remove Interactive Remove Key Performance Indicator Remove Marketing Remove Optimization
article thumbnail

What Is An Operational Report? A Complete Guide

FineReport

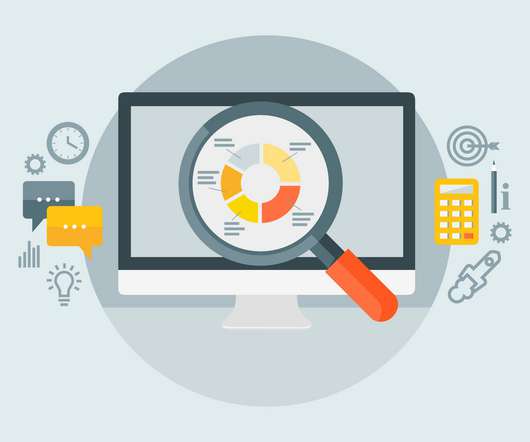
By accessing visually engaging interactive insights, you can enhance your decision-making processes to optimize your operations. The value of these analytical tools stems from their ability to offer an interactive approach to data. Marketing is the crucial initial step in acquiring customers and generating profits.

article thumbnail

Conversational AI use cases for enterprises

IBM Big Data Hub

The emergence of NLG has dramatically improved the quality of automated customer service tools, making interactions more pleasant for users, and reducing reliance on human agents for routine inquiries. These technologies enable systems to interact, learn from interactions, adapt and become more efficient. billion by 2030.

Insiders

Sign Up for our Newsletter

This site is protected by reCAPTCHA and the Google Privacy Policy and Terms of Service apply.

article thumbnail

What is a KPI Report? Definition, Examples, and How-tos

FineReport

Key Performance Indicators (KPIs) serve as vital metrics that help measure progress towards business goals. A KPI report, also known as KPI reporting, serves as a management tool for measuring, organizing, and analyzing the primary key performance indicators that are vital to a business.

KPI 52
article thumbnail

Elevating E-commerce with Data: How InsightOut Transforms Data into Profi

InsightOut

From understanding customer behavior to optimizing supply chains, the right data can propel an online business to new heights. This is where InsightOut steps in, offering e-commerce companies the tools they need to clean, analyze, and report on key data metrics. Customized Reporting Data is most powerful when it's understandable.

article thumbnail

An Introduction To Data Dashboards: Meaning, Definition & Industry Examples

datapine

Data dashboards provide a centralized, interactive means of monitoring, measuring, analyzing, and extracting a wealth of business insights from relevant datasets in several key areas while displaying aggregated information in a way that is both intuitive and visual. Exclusive Bonus Content: Ready to make analytics straightforward?

article thumbnail

Getting Started With Incremental Sales – Best Practices & Examples

datapine

Incremental sales is a KPI used by marketers to assess the financial value of various promotional activities. It calculates a business’s revenue from its marketing campaigns above what they normally sell and helps build successful strategies to ensure continuous growth. What Are Incremental Sales? Keep reading to find out!

Sales 176
article thumbnail

Combine transactional, streaming, and third-party data on Amazon Redshift for financial services

AWS Big Data

Additionally, they need streaming architectures to handle growing trade volumes, market volatility, and regulatory demands. Trade quality is not only related to broker performance, but is also a requirement from regulators, starting with MIFID II.