Remove Key Performance Indicator Remove Measurement Remove Modeling Remove Visualization
article thumbnail

Defining clear metrics to drive model adoption and value creation

Domino Data Lab

It’s often stated that nothing changes inside an enterprise because you’ve built a model. In some cases, data science does generate models directly to revenue, such as a contextual deal engine that targets people with offers that they can instantly redeem. These indicators can be broken into three key categories.

Metrics 93
article thumbnail

Smarten Announces SnapShot Anomaly Monitoring Alerts: Powerful Tools for Business Users!

Smarten

Smarten CEO, Kartik Patel says, ‘Smarten SnapShot supports the evolving role of Citizen Data Scientists with interactive tools that allow a business user to gather information, establish metrics and key performance indicators.’

Insiders

Sign Up for our Newsletter

This site is protected by reCAPTCHA and the Google Privacy Policy and Terms of Service apply.

article thumbnail

The steep cost of a poor data management strategy

CIO Business Intelligence

Leveraging that data, in AI models, for example, depends entirely on the accessibility, quality, granularity, and latency of your organization’s data. Simply put, data management is a sophisticated process involving various stages, such as data storage, processing, analysis, and visualization.

Strategy 105
article thumbnail

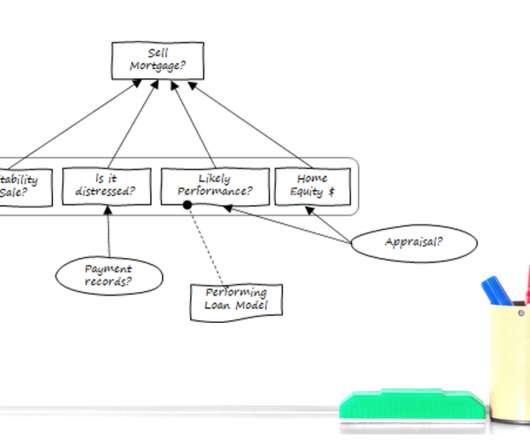
Make Your Investment in Analytic Technology Pay Off With Decision Requirements Modeling

Decision Management Solutions

Like many enterprises, you’ve likely made a hefty investment in analytic technology—from interactive dashboards and advanced visualization tools to data mining, predictive analytics, machine learning (ML), and artificial intelligence (AI). Focusing on decision-making changes everything. We can show you how to accomplish this. Get started.

article thumbnail

Take Advantage Of Operational Metrics & KPI Examples – A Comprehensive Guide

datapine

We have written about management reporting methods that can be utilized in the modern practice of creating powerful analysis, bringing complex data into simple visuals, and employ them to make actionable decisions. Your Chance: Want to visualize & track operational metrics with ease? What gets measured gets done.” – Peter Drucker.

KPI 269
article thumbnail

A Guide To The Methods, Benefits & Problems of The Interpretation of Data

datapine

Capable of displaying key performance indicators (KPIs) for both quantitative and qualitative data analyses, they are ideal for making the fast-paced and data-driven market decisions that push today’s industry leaders to sustainable success. Business dashboards are the digital age tools for big data.

article thumbnail

8 Examples Of Financial Reports You Can Use For Daily, Weekly, And Monthly Reports

datapine

These are powerful tools that you can apply to increase internal business performance. A data-driven finance report is also an effective means of remaining updated with any significant progress or changes in the status of your finances, and help you measure your financial results, cash flow, and financial position.

Reporting 251