article thumbnail

How Good Leaders Keep Data in Perspective

Smart Data Collective

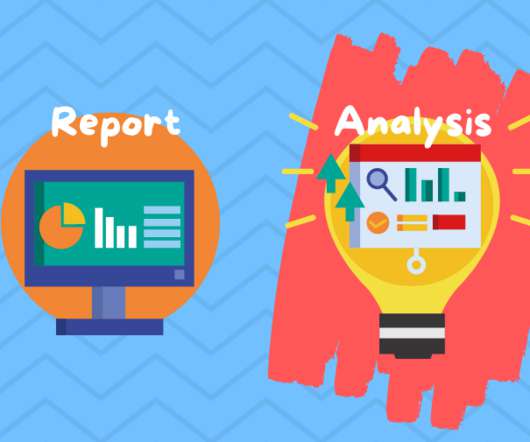
With better benchmarks, KPIs, and statistics , business leaders can better understand their environments and ultimately make more objective, logical decisions. Key performance indicators (KPIs) can serve as excellent measuring sticks that guide your progress and allow you to define and evaluate success.

article thumbnail

Your Ultimate Guide To Modern KPI Reports In The Digital Age – Examples & Templates

datapine

Typically presented in the form of an interactive dashboard , this kind of report provides a visual representation of the data associated with your predetermined set of key performance indicators – or KPI data, for short. Pick a couple of indicators that will track and assess the performance.

KPI 223
Insiders

Sign Up for our Newsletter

This site is protected by reCAPTCHA and the Google Privacy Policy and Terms of Service apply.

Trending Sources

article thumbnail

Huabao sniffs out the ultimate efficiency formula

CIO Business Intelligence

Without visualized analytics, it was difficult to bridge the void between expectation and accurate analysis. The objectives were lofty: integrated, scalable, and replicable enterprise management; streamlined business processes; and visualized risk control, among other aims, all fully integrating finance, logistics, production, and sales.

article thumbnail

Smarten Announces SnapShot Anomaly Monitoring Alerts: Powerful Tools for Business Users!

Smarten

Smarten CEO, Kartik Patel says, ‘Smarten SnapShot supports the evolving role of Citizen Data Scientists with interactive tools that allow a business user to gather information, establish metrics and key performance indicators.’

article thumbnail

A Guide To Starting A Career In Business Intelligence & The BI Skills You Need

datapine

According to the US Bureau of Labor Statistics, demand for qualified business intelligence analysts and managers is expected to soar to 14% by 2026, with the overall need for data professionals to climb to 28% by the same year. The Bureau of Labor Statistics also states that in 2015, the annual median salary for BI analysts was $81,320.

article thumbnail

Your Data Won’t Speak Unless You Ask It The Right Data Analysis Questions

datapine

But if you find a development opportunity, and see that your business performance can be significantly improved, then a KPI dashboard software could be a smart investment to monitor your key performance indicators and provide a transparent overview of your company’s data. 8) What data visualizations should you choose?

IT 317
article thumbnail

Your Definitive Guide To Building Valuable Narratives Through Data Storytelling

datapine

Stories inspire, engage, and have the unique ability to transform statistical information into a compelling narrative that can significantly enhance business success. According to a study performed by Skyword, content that features a mix of words and visuals drives 34% more engagement than text-only articles, blog posts, or whitepapers.

KPI 193