Remove kpi-examples-and-templates human-resources
article thumbnail

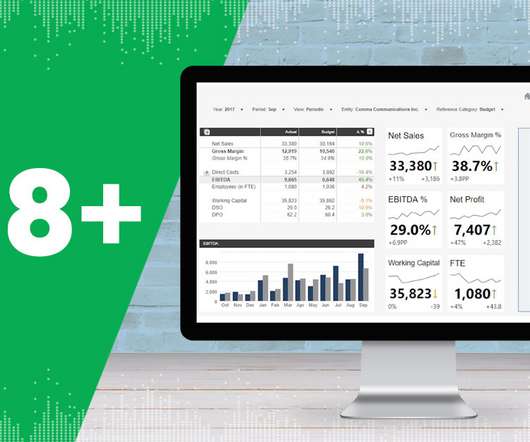
Discover The Power Of Modern Performance Reports – See Examples & Best Practices 

datapine

2) The Importance of Performance Reports 3) Performance Report Examples 4) Performance Reporting Tips Performance reporting has been a traditional business practice for decades now. Keep reading to find a definition, benefits, examples, and some key best practices to generate them successfully!

Reporting 207
article thumbnail

A Complete Guide To Bar Charts With Examples, Benefits, And Different Types 

datapine

2) Pros & Cons Of Bar Charts 3) When To Use A Bar Graph 4) Types Of Bar Charts 5) Bar Graphs & Charts Best Practices 6) Bar Chart Examples In today’s fast-paced analytical landscape, data visualization has become one of the most powerful tools organizations can benefit from to be successful with their analytical efforts.

Insiders

Sign Up for our Newsletter

This site is protected by reCAPTCHA and the Google Privacy Policy and Terms of Service apply.

article thumbnail

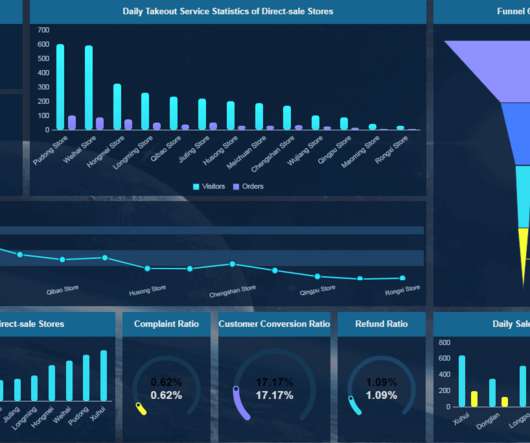
Take Advantage Of Operational Metrics & KPI Examples – A Comprehensive Guide

datapine

Now we will focus on operational KPIs and metrics that can ultimately bring the indispensable value out of the overall business performance, by concentrating on the most important business question: what can I do to perform even better? But first, let’s begin with a general understanding of key metrics and their usage in business.

KPI 269
article thumbnail

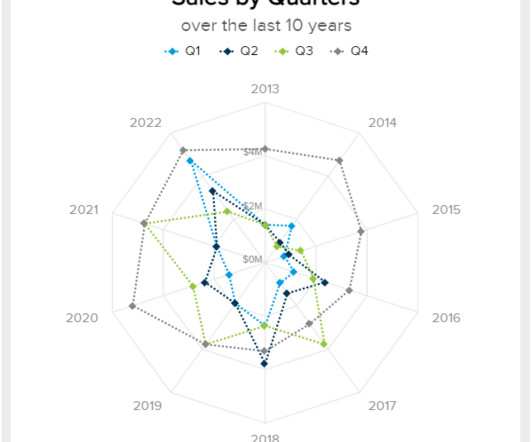
Your Definitive Guide To Building Valuable Narratives Through Data Storytelling

datapine

Here, we’ll explore the unrivaled power of data storytelling in the digital age while looking at a mix of powerful data storytelling examples generated with a modern dashboard creator. Exclusive Bonus Content: Your definitive guide to data storytelling! Download our free executive summary and start creating your stories!

KPI 193
article thumbnail

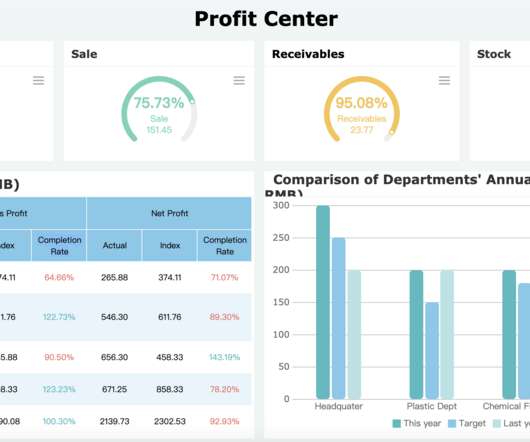
What is a KPI Report? Definition, Examples, and How-tos

FineReport

To effectively monitor and analyze these metrics, businesses utilize KPI reports. In this article, we will explore the concept of KPI reports, highlight their significance, provide examples and templates, discuss the essential components, and offer valuable insights on creating KPI reports efficiently.

KPI 52
article thumbnail

Understanding The Value Of Column Charts With Examples & Templates 

datapine

2) Pros & Cons Of Column Charts 3) When To Use A Column Graph 4) Types Of Column Charts 5) Column Graphs & Charts Best Practices 6) Column Chart Examples Data visualization has been a part of our lives for many many years now. Let’s get started with the definition! What Is A Column Chart or Graph?

article thumbnail

How Recruitment Metrics & Dashboards Can Help Improve Hiring New Candidates

datapine

By utilizing recruiting KPIs presented through the medium of visual and interactive HR dashboards , it’s possible to use recruitment metrics to better interpret and evaluate a variety of talent acquisition factors that aid in hiring processes. According to ManpowerGroup, around 72.8% That’s where recruitment metrics come in.

Metrics 210