

KPI Dashboard during Covid and Beyond
BizAcuity
AUGUST 3, 2021
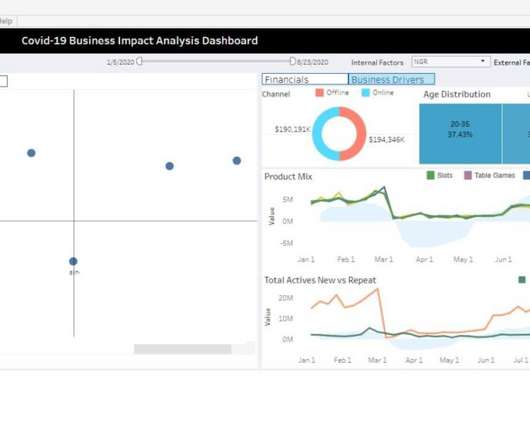
How to measure KPIs. KPIs are measured daily, monthly, quarterly, and yearly period of intervals. Output measured at various time intervals will provide a different perspective into the KPI which we are measuring. . Analyzing KPIs. The post KPI Dashboard during Covid and Beyond appeared first on BizAcuity Solutions Pvt.


Let's personalize your content