Remove Measurement Remove Predictive Modeling Remove Statistics Remove Visualization
article thumbnail

What is business analytics? Using data to improve business outcomes

CIO Business Intelligence

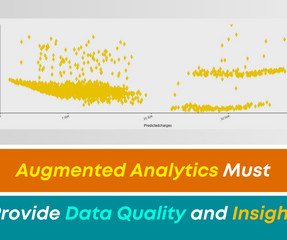
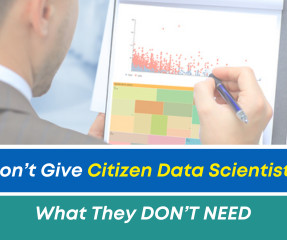
Business analytics is the practical application of statistical analysis and technologies on business data to identify and anticipate trends and predict business outcomes. Data analytics is used across disciplines to find trends and solve problems using data mining , data cleansing, data transformation, data modeling, and more.

article thumbnail

The top 15 big data and data analytics certifications

CIO Business Intelligence

Certifications measure your knowledge and skills against industry- and vendor-specific benchmarks to prove to employers that you have the right skillset. Candidates show facility with data concepts and environments; data mining; data analysis; data governance, quality, and controls; and visualization.

Big Data 121
Insiders

Sign Up for our Newsletter

This site is protected by reCAPTCHA and the Google Privacy Policy and Terms of Service apply.

Trending Sources

article thumbnail

Augmented Analytics Must Provide Data Quality and Insight!

Smarten

Whether you are trying to solve a business problem, get to the heart of that problem, find a business opportunity, predict the need for resources, new products or locations or understanding changes in your customer buying behavior, you don’t have time to learn complex tools or take training in analytics.

article thumbnail

What is data analytics? Analyzing and managing data for decisions

CIO Business Intelligence

The chief aim of data analytics is to apply statistical analysis and technologies on data to find trends and solve problems. Data analytics draws from a range of disciplines — including computer programming, mathematics, and statistics — to perform analysis on data in an effort to describe, predict, and improve performance.

article thumbnail

Smarten Announces SnapShot Anomaly Monitoring Alerts: Powerful Tools for Business Users!

Smarten

Smarten Augmented Analytics tools include Assisted Predictive Modeling , Smart Data Visualization , Self-Serve Data Preparation , Sentiment Analysis , and Clickless Analytics with natural language processing (NLP) for search analytics.

article thumbnail

What is Descriptive Statistics and How Do You Choose the Right One for Enterprise Analysis?

Smarten

This article provides a brief explanation of the definition and uses of the Descriptive Statistics algorithms. What is a Descriptive Statistics? Descriptive statistics helps users to describe and understand the features of a specific dataset, by providing short summaries and a graphic depiction of the measured data.

article thumbnail

Top 10 Analytics And Business Intelligence Trends For 2020

datapine

Spreadsheets finally took a backseat to actionable and insightful data visualizations and interactive business dashboards. Companies are no longer wondering if data visualizations improve analyses but what is the best way to tell each data-story. 2) Data Discovery/Visualization. Data exploded and became big.