Remove Metrics Remove Presentation Remove Snapshot Remove Visualization
article thumbnail

Your Definitive Guide To KPI Tracking By Utilizing Modern Software & Tools

datapine

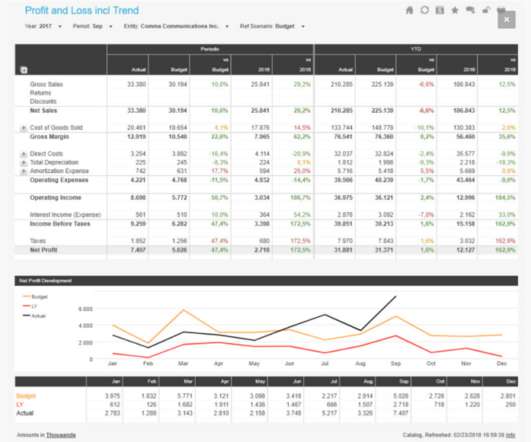
Here, we will consider what it takes to track KPI metrics, explore the dynamics or a contemporary KPI tracker, and look at how to track KPIs. By selecting the right KPIs for various areas of the business, it’s possible to use them to arrange as well as visualize large datasets. To track KPIs is to gain greater business intelligence.

KPI 195
article thumbnail

Your Definitive Guide To Building Valuable Narratives Through Data Storytelling

datapine

By gaining centralized access to business data and presenting it in a visual way that follows a logical path and provides invaluable insights on a particular area or subject, you stand to set yourself apart from your competitors and become a leader in your field. Download our free executive summary and start creating your stories!

KPI 193
Insiders

Sign Up for our Newsletter

This site is protected by reCAPTCHA and the Google Privacy Policy and Terms of Service apply.

article thumbnail

Top 10 Management Reporting Best Practices To Create Effective Reports

datapine

But, these reports are only as useful as the work that goes into preparing and presenting them. They collect data from various departments of the company tracking key performance indicators ( KPIs ) and present them in an understandable way. Let’s dive into the best practices for preparing and presenting them.

Reporting 263
article thumbnail

Best Dashboard Ideas & Design Examples To Boost Your Business Success

datapine

The ability to monitor, visualize, and analyze relevant data gives today’s businesses, across a host of sectors, the power to understand their prospects, make informed decisions, increase efficiencies, and work towards a set of rewarding long term goals. The Value Of Different Dashboard Ideas & Designs.

article thumbnail

Take Advantage Of The Top 16 Sales Graphs And Charts To Boost Your Business

datapine

From sales performance and targets through to customer acquisition costs, sales cycle, and beyond — here, we’ll present sales graphs and charts that matter to the ongoing growth of your business, in turn considering the essential question, what type of charts are used for sales? How Do You Know Which Graph To Use? 1) Sales Performance.

Sales 235
article thumbnail

Utilize The Effectiveness Of Professional Executive Dashboards & Reports

datapine

By gaining the ability to gather, organize and analyze the metrics that are most important to your organization, you stand to make your business empire more intelligent than ever before – and executive reporting and business dashboards will help you do just that. 90% of the information transmitted to the brain is visual.

article thumbnail

Your Ultimate Guide To Modern KPI Reports In The Digital Age – Examples & Templates

datapine

Typically presented in the form of an interactive dashboard , this kind of report provides a visual representation of the data associated with your predetermined set of key performance indicators – or KPI data, for short. Set up a report which you can visualize with an online dashboard. Consider your data sources.

KPI 223