Remove 2006 Remove Business Intelligence Remove Dashboards Remove Visualization
article thumbnail

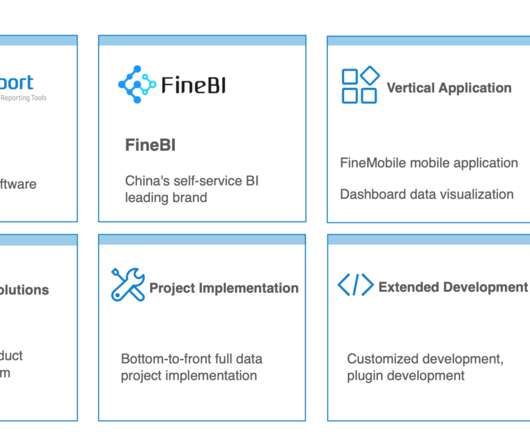
IDC: FanRuan ranks No.1 in China’s BI market share in H1 2019

FineReport

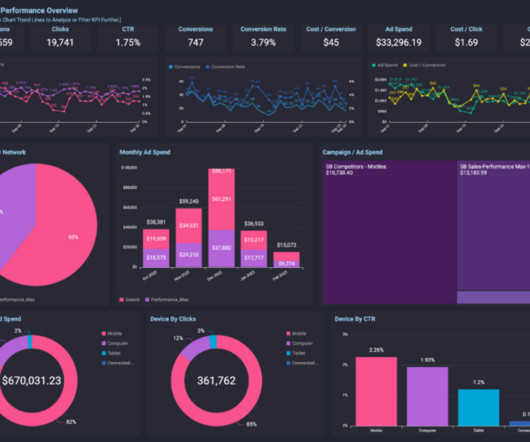
According to IDC Semiannual Software Tracker for the First Half of 2019, China’s business intelligence software market size was $ 210 million in the first half of 2019, with a year-on-year increase of 24.6%. By 2023, the size of China’s business intelligence software market will reach $ 1.65 respectively.

article thumbnail

CRM’s Have a Big Data Technical Debt Problem: Here’s How to Fix It

Smart Data Collective

Created in 2006, Snapshot was the first CRM management solution designed specifically for Salesforce and was one of the first Apps to be offered on the Salesforce AppExchange. Visualize the problem. Reports and dashboards can also go stale. Metazoa Snapshot, Pillir’s technical debt dashboard and ELEVATE are great examples.

Big Data 132
Insiders

Sign Up for our Newsletter

This site is protected by reCAPTCHA and the Google Privacy Policy and Terms of Service apply.

article thumbnail

QlikView vs Qlik Sense vs FineReport, who is better BI tool in 2023?

FineReport

Users can create visual reports according to their own wishes and achieve self-service analysis. FineReport is a very mature reporting tool launched by Fanruan Software in 2006. Target audience Qlik Sense targets professional analysts and business users who are familiar with analytical methods.

article thumbnail

Position2’s Arena Calibrate helps customers drive marketing efficiency with Amazon QuickSight Embedded

AWS Big Data

Position 2 was established in 2006 in Silicon Valley and has a clientele spanning American Express, Lenovo, Fujitsu, and Thales. Arena Calibrate is a customizable digital marketing dashboard that helps marketers track their cross-platform performance at a glance, saving them hours of manual work.

article thumbnail

Goodbye Oracle Discoverer, Hello Next-Generation Reporting

Jet Global

Migrating to the more complex and expensive Oracle Business Intelligence Enterprise Edition (OBIEE). Because Discoverer has been non-strategic since 2006, it’s a challenge for IT to successfully write reports. OBIEE is a strategic BI tool that provides a web platform with attractive dashboards suitable for C-level needs.

article thumbnail

Web Analytics: Frequently Asked Questions And Direct Answers

Occam's Razor

And to visualize it in a report. Without knowing what you want to show it is hard to make a recommendation as to how to visualize. There is no upper limit to effective ways to visualize data. There is no upper limit to effective ways to visualize data. Sanchit Somani: How to define the perfect dashboard?