article thumbnail

Understanding The Value Of Column Charts With Examples & Templates 

datapine

2) Pros & Cons Of Column Charts 3) When To Use A Column Graph 4) Types Of Column Charts 5) Column Graphs & Charts Best Practices 6) Column Chart Examples Data visualization has been a part of our lives for many many years now. They are easy to understand: Column graphs are one of the easiest visualizations to understand.

article thumbnail

Data Visualization Inspiration: Analysis To Insights To Action, Faster!

Occam's Razor

Like a vast majority on planet Earth, I love data visualizations. A day-to-day manifestation of this love is on my Google+ or Facebook profiles where 75% of my posts are related to my quick analysis and learnings from a visualization. Data visualized is data understood. But for a visual person like me, this is the ah-ha moment.

Insiders

Sign Up for our Newsletter

This site is protected by reCAPTCHA and the Google Privacy Policy and Terms of Service apply.

Trending Sources

article thumbnail

A perfect match: How tech promoted a small soccer team to the top

CIO Business Intelligence

Thanks to this injection of capital, which allowed it to improve its squad through new hires, Hoffenheim finally reached the Germany’s first division in the 2007-2008 season. It was the beginning of a close relationship between SAP and Hoffenheim, which continues today.

Sales 52
article thumbnail

The Week The Modern Analytics and BI Market Changed Forever

Rita Sallam

CIOs will watch the combined roadmap closely for evidence that Google will continue to support and invest in Looker’s multicloud optimizations as promised. The Google acquisition of Looker fills a gap in the Google analytics stack with a clear set of synergies and architectural alignment.

Marketing 110
article thumbnail

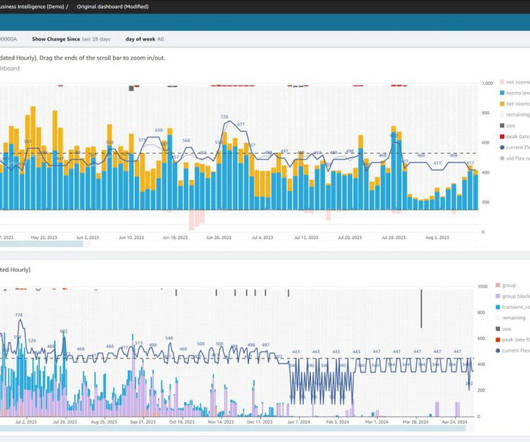
BWH Hotels scales enterprise business intelligence adoption while reducing costs with Amazon QuickSight

AWS Big Data

Having used Cognos since 2008, this was not just a lift-and-shift migration. With these dashboards, our sales teams at both the corporate and property levels are able to score customer and corporate accounts so that they can optimize how they use their time.

article thumbnail

Real-Real-World Programming with ChatGPT

O'Reilly on Data

And if I switch tabs to view a paper from 2008, then a song from 2008 could start up. To provide some coherence to the music, I decided to use Taylor Swift songs since her discography covers the time span of most papers that I typically read: Her main albums were released in 2006, 2008, 2010, 2012, 2014, 2017, 2019, 2020, and 2022.

article thumbnail

AI vs. BI for Business, What Do You Need?

Jet Global

Bloomberg economist Michael McDonough has tracked companies mentioning ‘artificial intelligence’ on earnings calls since 2008 and has found that while the number of mentions has ballooned, the actual applications have not 1. So what can AI actually do? Facebook’s facial recognition photo tagging is an example of a vision system.