Remove 2009 Remove Data-driven Remove Measurement Remove Statistics
article thumbnail

Brand Measurement: Analytics & Metrics for Branding Campaigns

Occam's Razor

One of the ultimate excuses for not measuring impact of Marketing campaigns is: "Oh, that's just a branding campaign." If supported by "data" then it tends to be of the most fragile kind (usually the the fact that the CEO saw it during the Super Bowl and felt happy suffices as actionable data).

article thumbnail

Understanding Simpson’s Paradox to Avoid Faulty Conclusions

Sisense

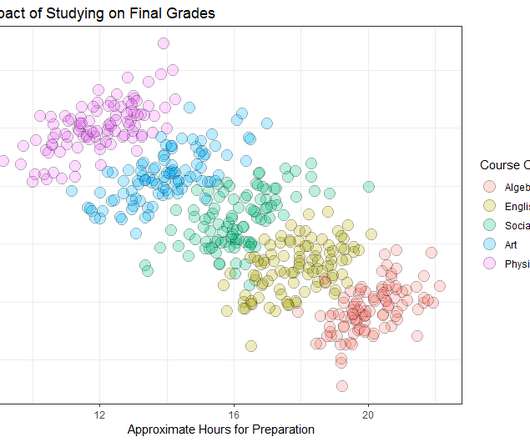
Everyone wants to get more out of their data, but how exactly to do that can leave you scratching your head. One of the simplest ways to start exploring your data is to aggregate the metrics you are interested in by their relevant dimensions. How can good data lead to faulty conclusions? How does this happen? 9/10 = 90%.

Testing 104
Insiders

Sign Up for our Newsletter

This site is protected by reCAPTCHA and the Google Privacy Policy and Terms of Service apply.

Trending Sources

article thumbnail

The Lean Analytics Cycle: Metrics > Hypothesis > Experiment > Act

Occam's Razor

We are far too enamored with data collection and reporting the standard metrics we love because others love them because someone else said they were nice so many years ago. First, you figure out what you want to improve; then you create an experiment; then you run the experiment; then you measure the results and decide what to do.

Metrics 156
article thumbnail

Fact-based Decision-making

Peter James Thomas

These normally appear at the end of an article, but it seemed to make sense to start with them in this case: Recently I published Building Momentum – How to begin becoming a Data-driven Organisation. A number of factors can play into the accuracy of data capture. Honesty of Data that is captured. Timing issues with Data.

Metrics 49
article thumbnail

Themes and Conferences per Pacoid, Episode 9

Domino Data Lab

For example, common practices for collecting data to build training datasets tend to throw away valuable information along the way. The lens of reductionism and an overemphasis on engineering becomes an Achilles heel for data science work. ML model interpretability and data visualization. back to the structure of the dataset.

article thumbnail

Misleading Statistics Examples – Discover The Potential For Misuse of Statistics & Data In The Digital Age

datapine

1) What Is A Misleading Statistic? 2) Are Statistics Reliable? 3) Misleading Statistics Examples In Real Life. 4) How Can Statistics Be Misleading. 5) How To Avoid & Identify The Misuse Of Statistics? If all this is true, what is the problem with statistics? What Is A Misleading Statistic?

article thumbnail

A Retrospective of 2018’s Articles

Peter James Thomas

This increase was driven in part by the launch of my new Maths & Science section , articles from which claimed no fewer than 6 slots in the 2018 top 10 articles, when measured by hits [1]. These are as follows: General Data Articles. Data Visualisation. Statistics & Data Science. Data Visualisation.