article thumbnail

Excellent Analytics Tips #20: Measuring Digital "Brand Strength"

Occam's Razor

Bonus One: Read: Brand Measurement: Analytics & Metrics for Branding Campaigns ]. There are many different tools, both online and offline, that measure the elusive metric called brand strength. I believe it is one of the best possible ways to measure what humanity is thinking, and telling us via the queries they run on Google.

article thumbnail

Smarten Augmented Analytics Receives CERT-IN Certification for Its Products and Services!

Smarten

” The Information Technology Amendment Act of 2009 designated CERT-IN as the national agency to perform functions for cyber security, including the collection, analysis and dissemination of information on cyber incidents, as well as taking emergency measures to handle incidents and coordinating cyber incident response activities.

Insiders

Sign Up for our Newsletter

This site is protected by reCAPTCHA and the Google Privacy Policy and Terms of Service apply.

article thumbnail

Brand Measurement: Analytics & Metrics for Branding Campaigns

Occam's Razor

One of the ultimate excuses for not measuring impact of Marketing campaigns is: "Oh, that's just a branding campaign." It is criminal not to measure your direct response campaigns online. I also believe that a massively under appreciated opportunity exists to truly measure impact of branding campaigns online.

article thumbnail

Software commodities are eating interesting data science work

Data Science and Beyond

When I started my PhD in 2009, the plan was to work on sentiment analysis of opinion polls. I learned about Bayesian statistics and conjugate priors. In reality, problem definition and solution measurement are more challenging and important. What can one do to remain relevant in such an environment? Read this post to find out.

Software 103
article thumbnail

Understanding Simpson’s Paradox to Avoid Faulty Conclusions

Sisense

This is an example of Simpon’s paradox , a statistical phenomenon in which a trend that is present when data is put into groups reverses or disappears when the data is combined. It’s time to introduce a new statistical term. They measured both the blood pressure of the participants and if they had a heart attack or not.

Testing 104
article thumbnail

Fitting Support Vector Machines via Quadratic Programming

Domino Data Lab

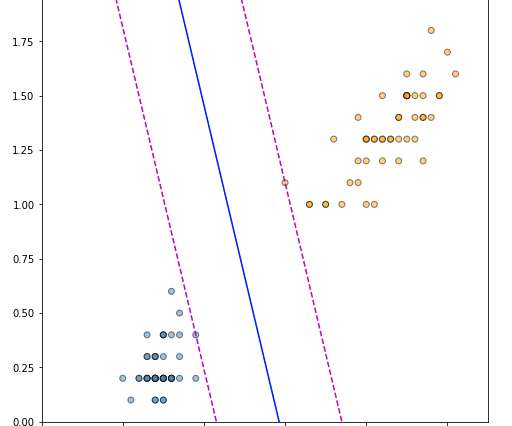
The intuition here is that a decision boundary that leaves a wider margin between the classes generalises better, which leads us to the key property of support vector machines — they construct a hyperplane in a such a way that the margin of separation between the two classes is maximised (Haykin, 2009). Derivation of a Linear SVM. Fisher, R.

article thumbnail

The Lean Analytics Cycle: Metrics > Hypothesis > Experiment > Act

Occam's Razor

First, you figure out what you want to improve; then you create an experiment; then you run the experiment; then you measure the results and decide what to do. For each of them, write down the KPI you're measuring, and what that KPI should be for you to consider your efforts a success. Measure and decide what to do.

Metrics 156