Remove 2012 Remove Dashboards Remove Optimization Remove Visualization
article thumbnail

Performance Dashboard: Facilitate The Performance of Your Business

FineReport

Performance dashboard can help you deal with various business problems. What is a performance dashboard? Companies can use performance dashboards to guide various indicators, ranging from checking the ability of a department to monitoring the availability of business strategies for global organizations.

article thumbnail

Understanding The Value Of Column Charts With Examples & Templates 

datapine

2) Pros & Cons Of Column Charts 3) When To Use A Column Graph 4) Types Of Column Charts 5) Column Graphs & Charts Best Practices 6) Column Chart Examples Data visualization has been a part of our lives for many many years now. They are easy to understand: Column graphs are one of the easiest visualizations to understand.

Insiders

Sign Up for our Newsletter

This site is protected by reCAPTCHA and the Google Privacy Policy and Terms of Service apply.

article thumbnail

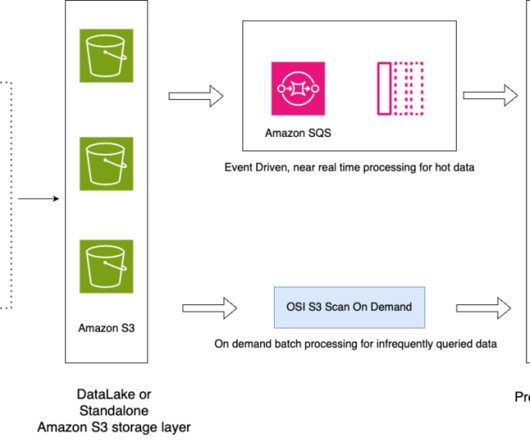
Petabyte-scale log analytics with Amazon S3, Amazon OpenSearch Service, and Amazon OpenSearch Ingestion

AWS Big Data

At the same time, they need to optimize operational costs to unlock the value of this data for timely insights and do so with a consistent performance. Cold storage is optimized to store infrequently accessed or historical data. Organizations often need to manage a high volume of data that is growing at an extraordinary rate.

Data Lake 118
article thumbnail

NHL turns to venue metrics data to drive sustainability

CIO Business Intelligence

He joined the league in 2012 as its first sustainability director with a mandate to find ways to embed sustainable business practices across the league and its member clubs. Sustainability is all about innovation and business optimization. The operational data is processed using SAP HANA Cloud and visualized with SAP Analytics Cloud.

Metrics 144
article thumbnail

Take Your SQL Skills To The Next Level With These Popular SQL Books

datapine

We have already given you our top data visualization books , top business intelligence books , and best data analytics books. With a MySQL dashboard builder , for example, you can connect all the data with a few clicks. This piece, published in 2012, offers a step-to-step guide on everything related to SQL.

article thumbnail

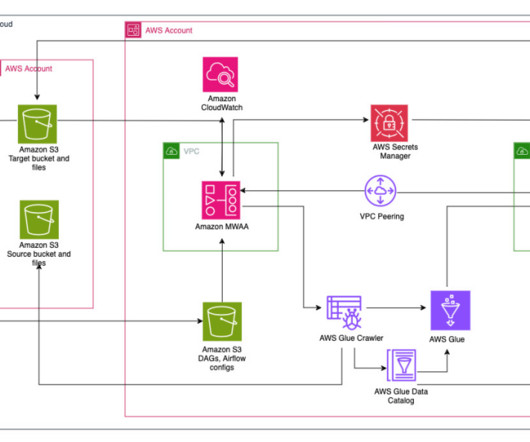
Orchestrate an end-to-end ETL pipeline using Amazon S3, AWS Glue, and Amazon Redshift Serverless with Amazon MWAA

AWS Big Data

Additionally, it enables cost optimization by aligning resources with specific use cases, making sure that expenses are well controlled. For more information, see Monitoring dashboards and alarms on Amazon MWAA. The Airflow DAG uses various operators, sensors, connections, tasks, and rules to run the data pipeline as needed.

Metadata 109
article thumbnail

Upcoming Power BI Workshop in Huntington Beach, CA – Apr 10, 2015

Ms SQL Girl

Actionable Visualization In Power BI. Power Query 101 (for Power BI Dashboard). Publishing and Administering Dashboards and Reports in Power BI for the Organisation. Her recent projects include delivering a SQL Server 2012 Data Warehouse and BI solutions for a number of high profile clients in the US and Australia.