Remove 2012 Remove Interactive Remove Optimization Remove Visualization
article thumbnail

Understanding The Value Of Column Charts With Examples & Templates 

datapine

2) Pros & Cons Of Column Charts 3) When To Use A Column Graph 4) Types Of Column Charts 5) Column Graphs & Charts Best Practices 6) Column Chart Examples Data visualization has been a part of our lives for many many years now. They are easy to understand: Column graphs are one of the easiest visualizations to understand.

article thumbnail

Enable cost-efficient operational analytics with Amazon OpenSearch Ingestion

AWS Big Data

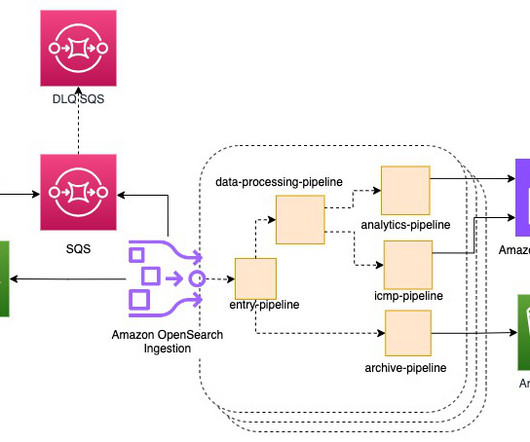
The raw data stored in Amazon S3 can be inexpensively retained for an extended period of time using tiered storage and queried using the Athena query engine, and also visualized using Amazon QuickSight or other data visualization services. Set up the VPC flow logs to publish logs to an S3 bucket in text format.

Analytics 117
Insiders

Sign Up for our Newsletter

This site is protected by reCAPTCHA and the Google Privacy Policy and Terms of Service apply.

article thumbnail

Why Metaversial Business Is a Very Long Way Off

Mark Raskino

He hypothesised that VR might deliver massive and complex information to the pattern recognition engine of the human brain via the visual cortex, to amplify human intelligence (IA), and that would be at least as important as AI. I do believe that one day business will commonly be conducted in a fully immersive 3D visual metaverse.

article thumbnail

Orchestrate an end-to-end ETL pipeline using Amazon S3, AWS Glue, and Amazon Redshift Serverless with Amazon MWAA

AWS Big Data

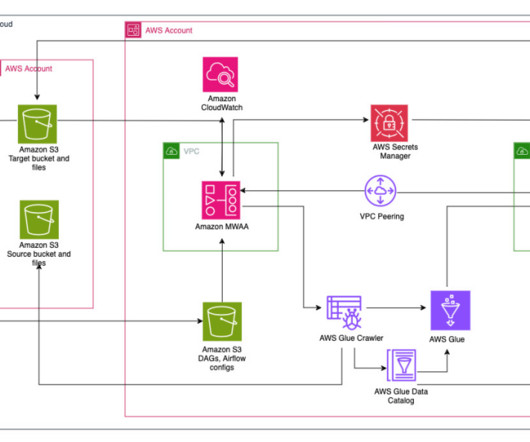
Additionally, it enables cost optimization by aligning resources with specific use cases, making sure that expenses are well controlled. VPC endpoints are created for Amazon S3 and Secrets Manager to interact with other resources. Usually, data engineers create an Airflow Directed Acyclic Graph (DAG) and commit their changes to GitHub.

Metadata 100
article thumbnail

Take Your SQL Skills To The Next Level With These Popular SQL Books

datapine

We have already given you our top data visualization books , top business intelligence books , and best data analytics books. This piece, published in 2012, offers a step-to-step guide on everything related to SQL. Its visually rich format is designed for the way your brain works, not in a text-heavy approach that puts you to sleep.

article thumbnail

Performance Dashboard: Facilitate The Performance of Your Business

FineReport

Performance dashboard is a data visualization tool for management, which is often used to measure employees’ performance, while helping business personnel measure, monitor, and manage the key activities and processes required to achieve business goals. How to reasonably determine the training and promotion of employees?

article thumbnail

Gain insights from historical location data using Amazon Location Service and AWS analytics services

AWS Big Data

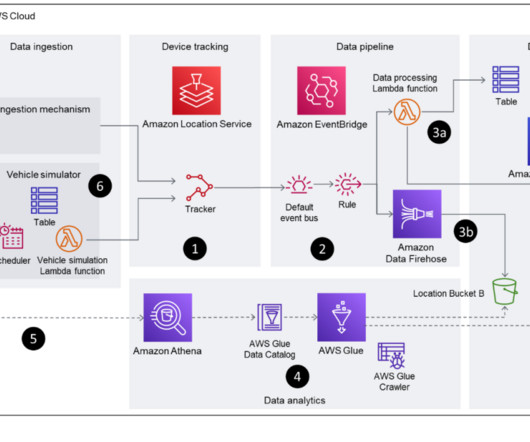
This method uses GZIP compression to optimize storage consumption and query performance. Visual layouts in some screenshots in this post may look different than those on your AWS Management Console. You can also use the data transformation feature of Data Firehose to invoke a Lambda function to perform data transformation in batches.