Remove 2020 Remove Business Intelligence Remove Data mining Remove Visualization
article thumbnail

Enterprise Reporting: The 2020’s Comprehensive Guide

FineReport

Enterprise reporting is a process of extracting, processing, organizing, analyzing, and displaying data in the companies. It uses enterprise reporting tools to organize data into charts, tables, widgets, or other visualizations. What Is the Difference Between Enterprise Reporting and Business Intelligence?

article thumbnail

Pelaporan Perusahaan: Panduan Komprehensif 2020

FineReport

Apa Perbedaan Antara Pelaporan Perusahaan dan Business Intelligence? Menurut arsitektur fungsional business intelligence, BI dapat dibagi menjadi tiga tingkat: tampilan, analisis, dan dukungan. Di bagian tengah adalah teknologi visualisasi data di tingkat tampilan. dan data bisnis tersebar di sistem independen ini.

OLAP 59
Insiders

Sign Up for our Newsletter

This site is protected by reCAPTCHA and the Google Privacy Policy and Terms of Service apply.

article thumbnail

Take Your SQL Skills To The Next Level With These Popular SQL Books

datapine

Business leaders, developers, data heads, and tech enthusiasts – it’s time to make some room on your business intelligence bookshelf because once again, datapine has new books for you to add. We have already given you our top data visualization books , top business intelligence books , and best data analytics books.

article thumbnail

5 Ways to Use Digital Signage for Data-Centric B2B Companies

Smart Data Collective

Businesses spent almost $21.5 billion on digital signage in 2020 alone. It can be even more useful if you use it with big data. Data analytics technology can help immensely at this and all subsequent stages. Set Goals and Develop a Strategy with Data Mining. Business Intelligence Tools.

B2B 115
article thumbnail

The New Normal for FP&A: Data Analytics

Jedox

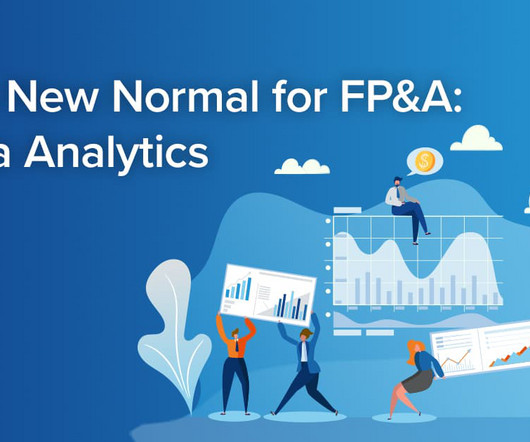
In addition to using data to inform your future decisions, you can also use current data to make immediate decisions. Some of the technologies that make modern data analytics so much more powerful than they used t be include data management, data mining, predictive analytics, machine learning and artificial intelligence.

article thumbnail

Choosing the Reporting Tools: 5 Things You Need To Know

FineReport

Enterprise Reporting For Visualization . As the types of charts become more diverse, and the visual effects become more impressive, traditional reporting software in the companies begins to play a role in data visualization. Business intelligence software is primarily for business people and data analysts.

article thumbnail

Top 10 Free and Open Source BI Tools in 2020

FineReport

Although compared to the paid version, not all free BI tool provides stunning data visualization; they offer easy-to-understand charts that can meet your basic needs. And, with Tableau Public, published workbooks are “disconnected” from the underlying data sources and require periodic updates when the data changes.

OLAP 105