article thumbnail

The DataOps Vendor Landscape, 2021

DataKitchen

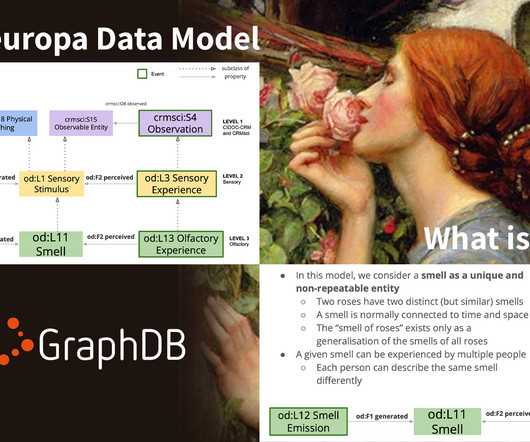
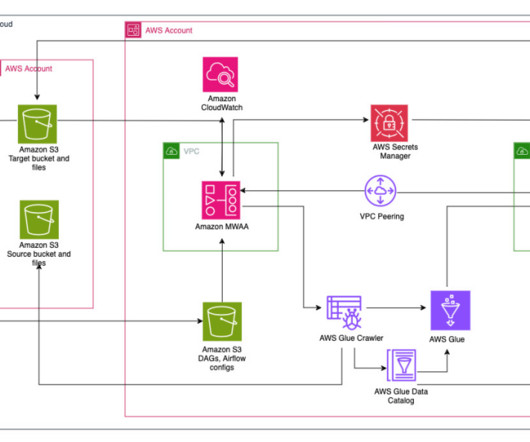
Download the 2021 DataOps Vendor Landscape here. DataOps is a hot topic in 2021. DataOps needs a directed graph-based workflow that contains all the data access, integration, model and visualization steps in the data analytic production process. Azure Repos – Unlimited, cloud-hosted private Git repos. .

Testing 300
article thumbnail

The Top 20 Data Visualization Books That Should Be On Your Bookshelf

datapine

Now that you’re sold on the power of data analytics in addition to data-driven BI, it’s time to take your journey a step further by exploring how to effectively communicate vital metrics and insights in a concise, inspiring, and accessible format through the power of visualization. That’s a colossal number of books on visualization.

Insiders

Sign Up for our Newsletter

This site is protected by reCAPTCHA and the Google Privacy Policy and Terms of Service apply.

Trending Sources

article thumbnail

GraphDB in Action: Smells Like Semantics Spirit

Ontotext

Take Google’s knowledge graph, underpinning Google’s search, we can use it to ask when a historical figure was born, which cities hosted the Olympics, how to get to the nearest pizza, and so on. In addition, an interactive visualization of the graph is available through GraphDB’s feature for rendering results as a visual graph.

article thumbnail

Take Your SQL Skills To The Next Level With These Popular SQL Books

datapine

We have already given you our top data visualization books , top business intelligence books , and best data analytics books. A host of notable brands and retailers with colossal inventories and multiple site pages use SQL to enhance their site’s structure functionality and MySQL reporting processes.

article thumbnail

The biggest enterprise technology M&A deals of the year

CIO Business Intelligence

Even though Nvidia’s $40 billion bid to shake up enterprise computing by acquiring chip designer ARM has fallen apart, the merger and acquisition (M&A) boom of 2021 looks set to continue in 2022, perhaps matching the peaks of 2015, according to a report from risk management advisor Willis Towers Watson. M&A volume climbed from $3.26

article thumbnail

Apache Ozone Powers Data Science in CDP Private Cloud

Cloudera

awsAccessKey=s3-spark-user/HOST@REALM.COM. Data processing and visualization. corr = usdf[usdf.rec_date < np.datetime64(' 2021-07-31 ')][[' people_fully_vaccinated ',' new_cases ']].corr() In a secure cluster, the following command is run to generate user specific credentials as any authenticated user. import boto3.

article thumbnail

Change Takes Time: How to Practice Patience in Report Redesign Processes

Depict Data Studio

In 2021, Abby joined the team at Veris Insights, where the focus is on bettering the world of work through providing first-class service and research on university recruiting and talent acquisition. Introduction to Data Visualization. How can I communicate that clearly, succinctly, and visually?”.