Remove Columns Applications-Insight
article thumbnail

AI recommendations for descriptions in Amazon DataZone for enhanced business data cataloging and discovery is now generally available

AWS Big Data

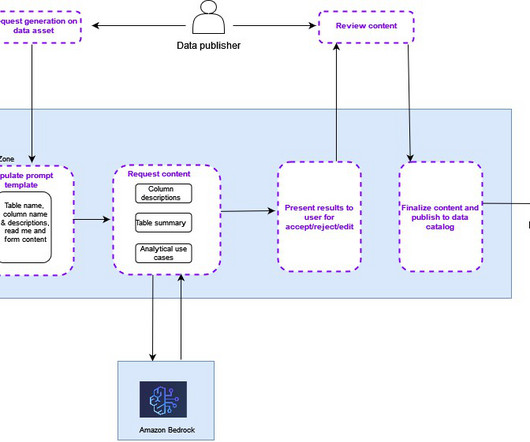
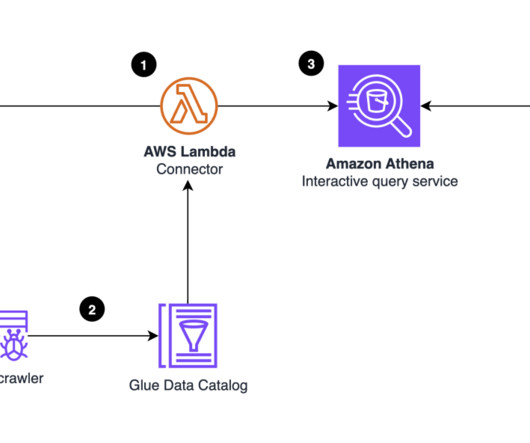
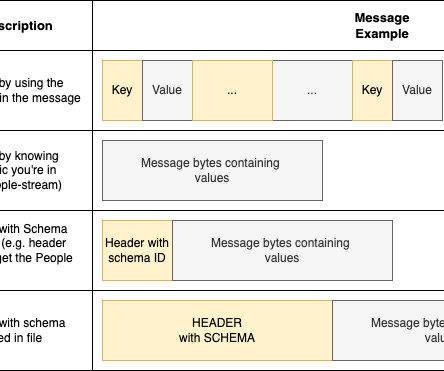
Introducing generative AI-powered data descriptions With AI-generated descriptions in Amazon DataZone, data consumers have these recommended descriptions to identify data tables and columns for analysis, which enhances data discoverability and cuts down on back-and-forth communications with data producers.

article thumbnail

Power analytics as a service capabilities using Amazon Redshift

AWS Big Data

Amazon Redshift is a cloud data warehouse service that offers real-time insights and predictive analytics capabilities for analyzing data from terabytes to petabytes. For example, you can build visualizations on top of Amazon Redshift and embed them within applications to provide outstanding analytics experiences for end-users.

Insiders

Sign Up for our Newsletter

This site is protected by reCAPTCHA and the Google Privacy Policy and Terms of Service apply.

article thumbnail

Understanding The Value Of Table Graphs & Charts – A Guide With Examples 

datapine

We have already covered many types of graphs and charts , including bar charts , column charts , area charts , line charts , and more. A table graph is a type of data visualization that uses rows and columns to organize and display numerical or textual data. That is, if columns and rows are arranged correctly.

article thumbnail

Derive operational insights from application logs using Automated Data Analytics on AWS

AWS Big Data

Automated Data Analytics (ADA) on AWS is an AWS solution that enables you to derive meaningful insights from data in a matter of minutes through a simple and intuitive user interface. The application (Lambda function) logs are sent to a CloudWatch log group. The data products for CloudWatch, Amazon S3, and DynamoDB are created in ADA.

article thumbnail

AI In Analytics: Today and Tomorrow!

Smarten

It is specifically designed for chatbot applications. Anomaly Alerts KPI monitoring and Auto Insights allows business users to quickly establish KPIs and target metrics and identify the Key Influencers and variables for the target KPI. Chat Generative Pretrained Transformer (ChatGPT) – ChatGPT is a transformer, based on GPT.

article thumbnail

How to build a decision tree model in IBM Db2

IBM Big Data Hub

Also, a column in the dataset indicates if each flight had arrived on time or late. SELECT NAME, COLTYPE, LENGTH FROM SYSIBM.SYSCOLUMNS WHERE TBCREATOR = 'FLIGHT' AND TBNAME = 'FLIGHTS_DATA' ORDER BY COLNO FLIGHTSTATUS is the response or the target column. Others are feature columns. Look into some sample records.

article thumbnail

Enrich your customer data with geospatial insights using Amazon Redshift, AWS Data Exchange, and Amazon QuickSight

AWS Big Data

The file has no column headers and is pipe delimited (|). Use Location Service to geocode and enrich address data Location Service lets you add location data and functionality to applications, which includes capabilities such as maps, points of interest, geocoding, routing, geofences, and tracking.