Remove Analytics Remove Dashboards Remove Measurement Remove ROI
article thumbnail

Discover Powerful Small Business Dashboards & KPIs To Track For Success

datapine

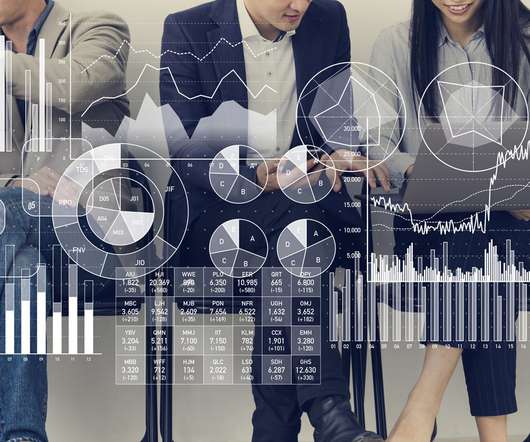
1) What Is A Small Business Dashboard? 3) Why Do You Need Small Business Dashboards. 4) Small Business Dashboard & KPIs Examples. Today, thanks to the rise of self-service BI tools, the analytical doors have been opened to a wider audience. Enter small business dashboards and metrics. Table of Contents.

article thumbnail

At a loss for data project ROI? Evaluate it like a product

CIO Business Intelligence

Today, Doug Laney, innovation fellow of data and analytics strategy at West Monroe, disputes Humby’s assertion on a technicality: “When you use a drop of oil, you can only use it one way at a time,” Laney says. times more likely when they demonstrated ROI on their BI or data analytics investments.

ROI 116
Insiders

Sign Up for our Newsletter

This site is protected by reCAPTCHA and the Google Privacy Policy and Terms of Service apply.

Trending Sources

article thumbnail

Get Started With Business Performance Dashboards – Examples & Templates

datapine

That said, if you’re looking to evolve your empire, increase brand awareness, and boost your bottom line, embracing business performance dashboards and big data should be at the top of your priority list. You need data-driven decisions, and a dashboard for business performance will make sure you reap the best possible rewards.

article thumbnail

Utilize The Effectiveness Of Professional Executive Dashboards & Reports

datapine

Without big data analytics, companies are blind and deaf, wandering out onto the Web like deer on a freeway. Exclusive Bonus Content: Executive Dashboards & Reports: A Summary. Companies that use data analytics are five times more likely to make faster decisions, based on a survey conducted by Bain & Company.

article thumbnail

Two Downs Make Two Ups: The Only Success Metrics That Matter For Your Data & Analytics Team

DataKitchen

How to measure your data analytics team? So it’s Monday, and you lead a data analytics team of perhaps 30 people. Like most leaders of data analytic teams, you have been doing very little to quantify your team’s success. The Data Change Request Ratio metric measures the rate of business demand for data.

Metrics 130
article thumbnail

Financial Dashboard: Definition, Examples, and How-tos

FineReport

This is where the significance of a financial dashboard shines through. In this article, we will explore the concept of a financial dashboard, highlight its numerous benefits, and provide various kinds of financial dashboard examples for you to employ and explore. What is A Financial Dashboard?

article thumbnail

The Ultimate Guide to Modern Data Quality Management (DQM) For An Effective Data Quality Control Driven by The Right Metrics

datapine

5) How Do You Measure Data Quality? quintillion bytes of data being produced on a daily basis and the wide range of online data analysis tools in the market, the use of data and analytics has never been more accessible. More generally, low-quality data can impact productivity, bottom line, and overall ROI. Table of Contents.